29
/pt/
pt
AIzaSyAYiBZKx7MnpbEhh9jyipgxe19OcubqV5w
April 1, 2024
215804
Oman
OMN
true
2
1
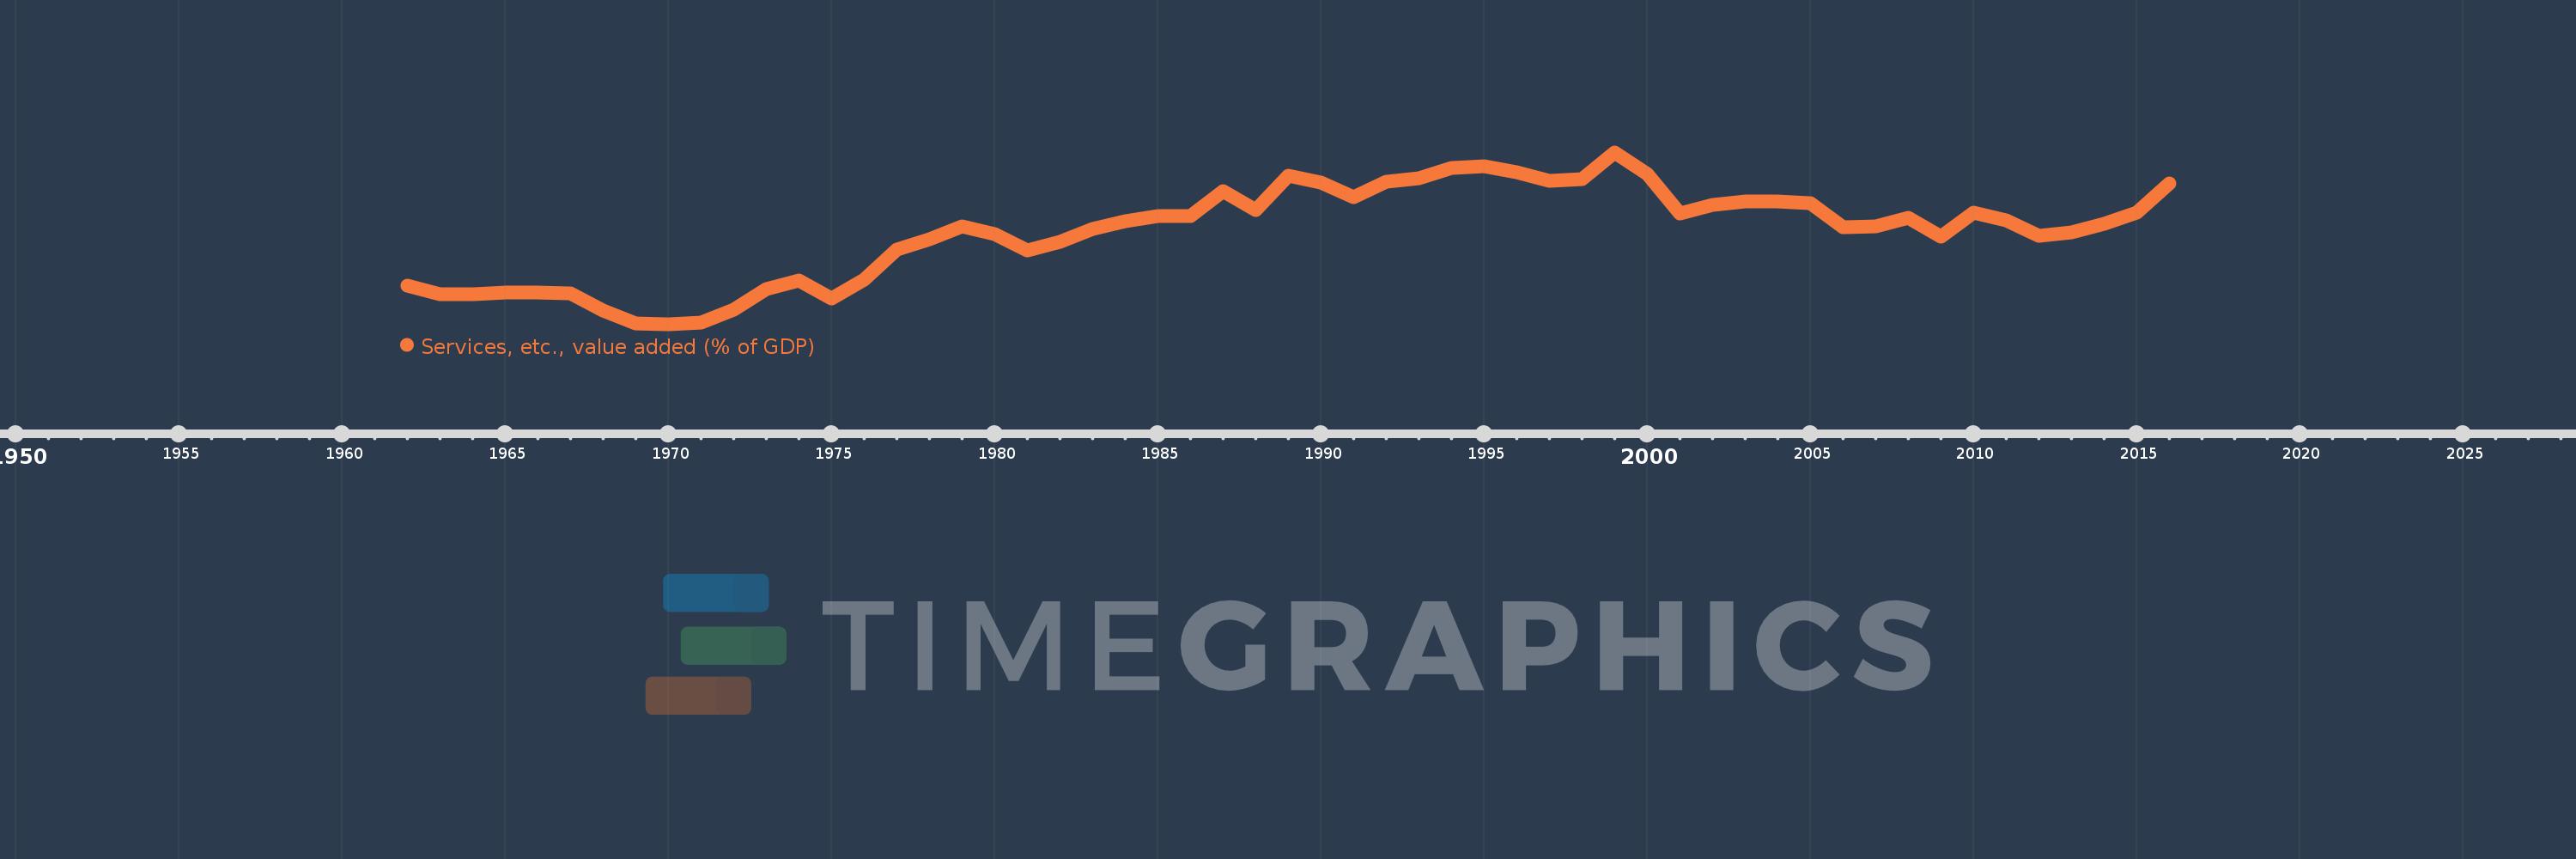
Services, etc., value added (% of GDP)
2016,2015,2014,2013,2012,2011,2010,2009,2008,2007,2006,2005,2004,2003,2002,2001,2000,1999,1998,1997,1996,1995,1994,1993,1992,1991,1990,1989,1988,1987,1986,1985,1984,1983,1982,1981,1980,1979,1978,1977,1976,1975,1974,1973,1972,1971,1970,1969,1968,1967,1966,1965,1964,1963,1962
Estas estatísticas em outros países:
AfghanistanAlbaniaAlgeriaAndorraAngolaAntigua and BarbudaArab WorldArgentinaArmeniaArubaAustraliaAustriaAzerbaijanBahamas, TheBahrainBangladeshBarbadosBelarusBelgiumBelizeBeninBermudaBhutanBoliviaBosnia and HerzegovinaBotswanaBrazilBrunei DarussalamBulgariaBurkina FasoBurundiCabo VerdeCambodiaCameroonCanadaCaribbean small statesCentral African RepublicCentral Europe and the BalticsChadChileChinaColombiaComorosCongo, Dem. Rep.Congo, Rep.Costa RicaCote d'IvoireCroatiaCubaCyprusCzech RepublicDenmarkDjiboutiDominicaDominican RepublicEarly-demographic dividendEast Asia & PacificEast Asia & Pacific (excluding high income)East Asia & Pacific (IDA & IBRD countries)EcuadorEgypt, Arab Rep.El SalvadorEquatorial GuineaEritreaEstoniaEthiopiaEuro areaEurope & Central AsiaEurope & Central Asia (excluding high income)Europe & Central Asia (IDA & IBRD countries)European UnionFaroe IslandsFijiFinlandFragile and conflict affected situationsFranceGabonGambia, TheGeorgiaGermanyGhanaGreeceGrenadaGuatemalaGuineaGuinea-BissauGuyanaHeavily indebted poor countries (HIPC)High incomeHondurasHong Kong SAR, ChinaHungaryIBRD onlyIcelandIDA & IBRD totalIDA blendIDA onlyIDA totalIndiaIndonesiaIran, Islamic Rep.IrelandItalyJamaicaJapanJordanKazakhstanKenyaKiribatiKorea, Rep.KosovoKuwaitKyrgyz RepublicLao PDRLate-demographic dividendLatin America & Caribbean Latin America & Caribbean (excluding high income)Latin America & the Caribbean (IDA & IBRD countries)LatviaLeast developed countries: UN classificationLebanonLesothoLibyaLithuaniaLow & middle incomeLow incomeLower middle incomeLuxembourgMacao SAR, ChinaMacedonia, FYRMadagascarMalawiMalaysiaMaldivesMaliMaltaMarshall IslandsMauritaniaMauritiusMexicoMicronesia, Fed. Sts.Middle East & North AfricaMiddle East & North Africa (excluding high income)Middle East & North Africa (IDA & IBRD countries)Middle incomeMoldovaMongoliaMontenegroMoroccoMozambiqueMyanmarNamibiaNepalNetherlandsNew CaledoniaNew ZealandNicaraguaNigerNigeriaNorth AmericaNorwayOECD membersOmanOther small statesPacific island small statesPakistanPalauPanamaPapua New GuineaParaguayPeruPhilippinesPolandPortugalPost-demographic dividendPre-demographic dividendPuerto RicoQatarRomaniaRussian FederationRwandaSao Tome and PrincipeSaudi ArabiaSenegalSerbiaSeychellesSierra LeoneSingaporeSlovak RepublicSloveniaSmall statesSolomon IslandsSomaliaSouth AfricaSouth AsiaSouth Asia (IDA & IBRD)SpainSri LankaSt. Kitts and NevisSt. LuciaSt. Vincent and the GrenadinesSub-Saharan Africa Sub-Saharan Africa (excluding high income)Sub-Saharan Africa (IDA & IBRD countries)SudanSurinameSwazilandSwedenSwitzerlandSyrian Arab RepublicTajikistanTanzaniaThailandTimor-LesteTogoTongaTrinidad and TobagoTunisiaTurkeyTurkmenistanTuvaluUgandaUkraineUnited KingdomUnited StatesUpper middle incomeUruguayUzbekistanVanuatuVenezuela, RBVietnamWest Bank and GazaWorldYemen, Rep.ZambiaZimbabwe Linha do tempo:
Nesta escala de tempo está apresentado um gráfico de 1962 ano até 2016 ano Oman. Dados de 1961 ano ausente. O número de observações reais por data: 55.
Fonte (nome):
Indicadores de desenvolvimento mundial
Fonte (organização):
World Bank national accounts data, and OECD National Accounts data files.
Categorias:
Economy & Growth
Foi atualizado:
23 abr 2017 ano
Indicadores de alterações dos valores ao longo dos anos
Máximo:
56.372
1 jan 1999 ano
Na data de observação
Valor
Mudança absoluta
A alteração em relação ao valor anterior
1 jan 1962 ano
17.791
+17.791
0.0%
1 jan 1963 ano
15.423
-2.369
-13.31%
1 jan 1964 ano
15.421
-0.002
-0.02%
1 jan 1965 ano
15.837
+0.417
2.7%
1 jan 1966 ano
15.929
+0.092
0.58%
1 jan 1967 ano
15.702
-0.227
-1.42%
1 jan 1968 ano
10.567
-5.135
-32.7%
1 jan 1969 ano
6.989
-3.578
-33.86%
1 jan 1970 ano
6.7
-0.289
-4.13%
1 jan 1971 ano
7.21
+0.51
7.61%
1 jan 1972 ano
10.791
+3.582
49.68%
1 jan 1973 ano
16.903
+6.112
56.64%
1 jan 1974 ano
19.303
+2.4
14.2%
1 jan 1975 ano
14.248
-5.055
-26.19%
1 jan 1976 ano
19.677
+5.429
38.1%
1 jan 1977 ano
28.192
+8.515
43.27%
1 jan 1978 ano
31.263
+3.071
10.89%
1 jan 1979 ano
34.971
+3.708
11.86%
1 jan 1980 ano
32.656
-2.315
-6.62%
1 jan 1981 ano
28.092
-4.564
-13.98%
1 jan 1982 ano
30.395
+2.304
8.2%
1 jan 1983 ano
34.169
+3.774
12.41%
1 jan 1984 ano
36.363
+2.194
6.42%
1 jan 1985 ano
37.986
+1.624
4.46%
1 jan 1986 ano
37.938
-0.048
-0.13%
1 jan 1987 ano
45.223
+7.285
19.2%
1 jan 1988 ano
39.722
-5.501
-12.16%
1 jan 1989 ano
49.741
+10.019
25.22%
1 jan 1990 ano
47.636
-2.105
-4.23%
1 jan 1991 ano
43.317
-4.318
-9.07%
1 jan 1992 ano
47.964
+4.646
10.73%
1 jan 1993 ano
48.877
+0.914
1.9%
1 jan 1994 ano
51.899
+3.021
6.18%
1 jan 1995 ano
52.36
+0.462
0.89%
1 jan 1996 ano
50.74
-1.621
-3.1%
1 jan 1997 ano
48.13
-2.61
-5.14%
1 jan 1998 ano
48.758
+0.628
1.3%
1 jan 1999 ano
56.372
+7.615
15.62%
1 jan 2000 ano
50.079
-6.293
-11.16%
1 jan 2001 ano
38.602
-11.477
-22.92%
1 jan 2002 ano
41.265
+2.662
6.9%
1 jan 2003 ano
42.206
+0.941
2.28%
1 jan 2004 ano
42.239
+0.033
0.08%
1 jan 2005 ano
41.798
-0.441
-1.04%
1 jan 2006 ano
34.849
-6.949
-16.62%
1 jan 2007 ano
34.897
+0.048
0.14%
1 jan 2008 ano
37.504
+2.607
7.47%
1 jan 2009 ano
31.948
-5.556
-14.81%
1 jan 2010 ano
38.92
+6.972
21.82%
1 jan 2011 ano
36.636
-2.284
-5.87%
1 jan 2012 ano
32.24
-4.396
-12.0%
1 jan 2013 ano
33.199
+0.959
2.97%
1 jan 2014 ano
35.815
+2.616
7.88%
1 jan 2015 ano
38.977
+3.162
8.83%
1 jan 2016 ano
47.423
+8.446
21.67%
Classificação de países por estatísticas atuais por anos


Comentários: