29
/pt/
pt
AIzaSyAYiBZKx7MnpbEhh9jyipgxe19OcubqV5w
April 1, 2024
240948
Singapore
SGP
true
2
1
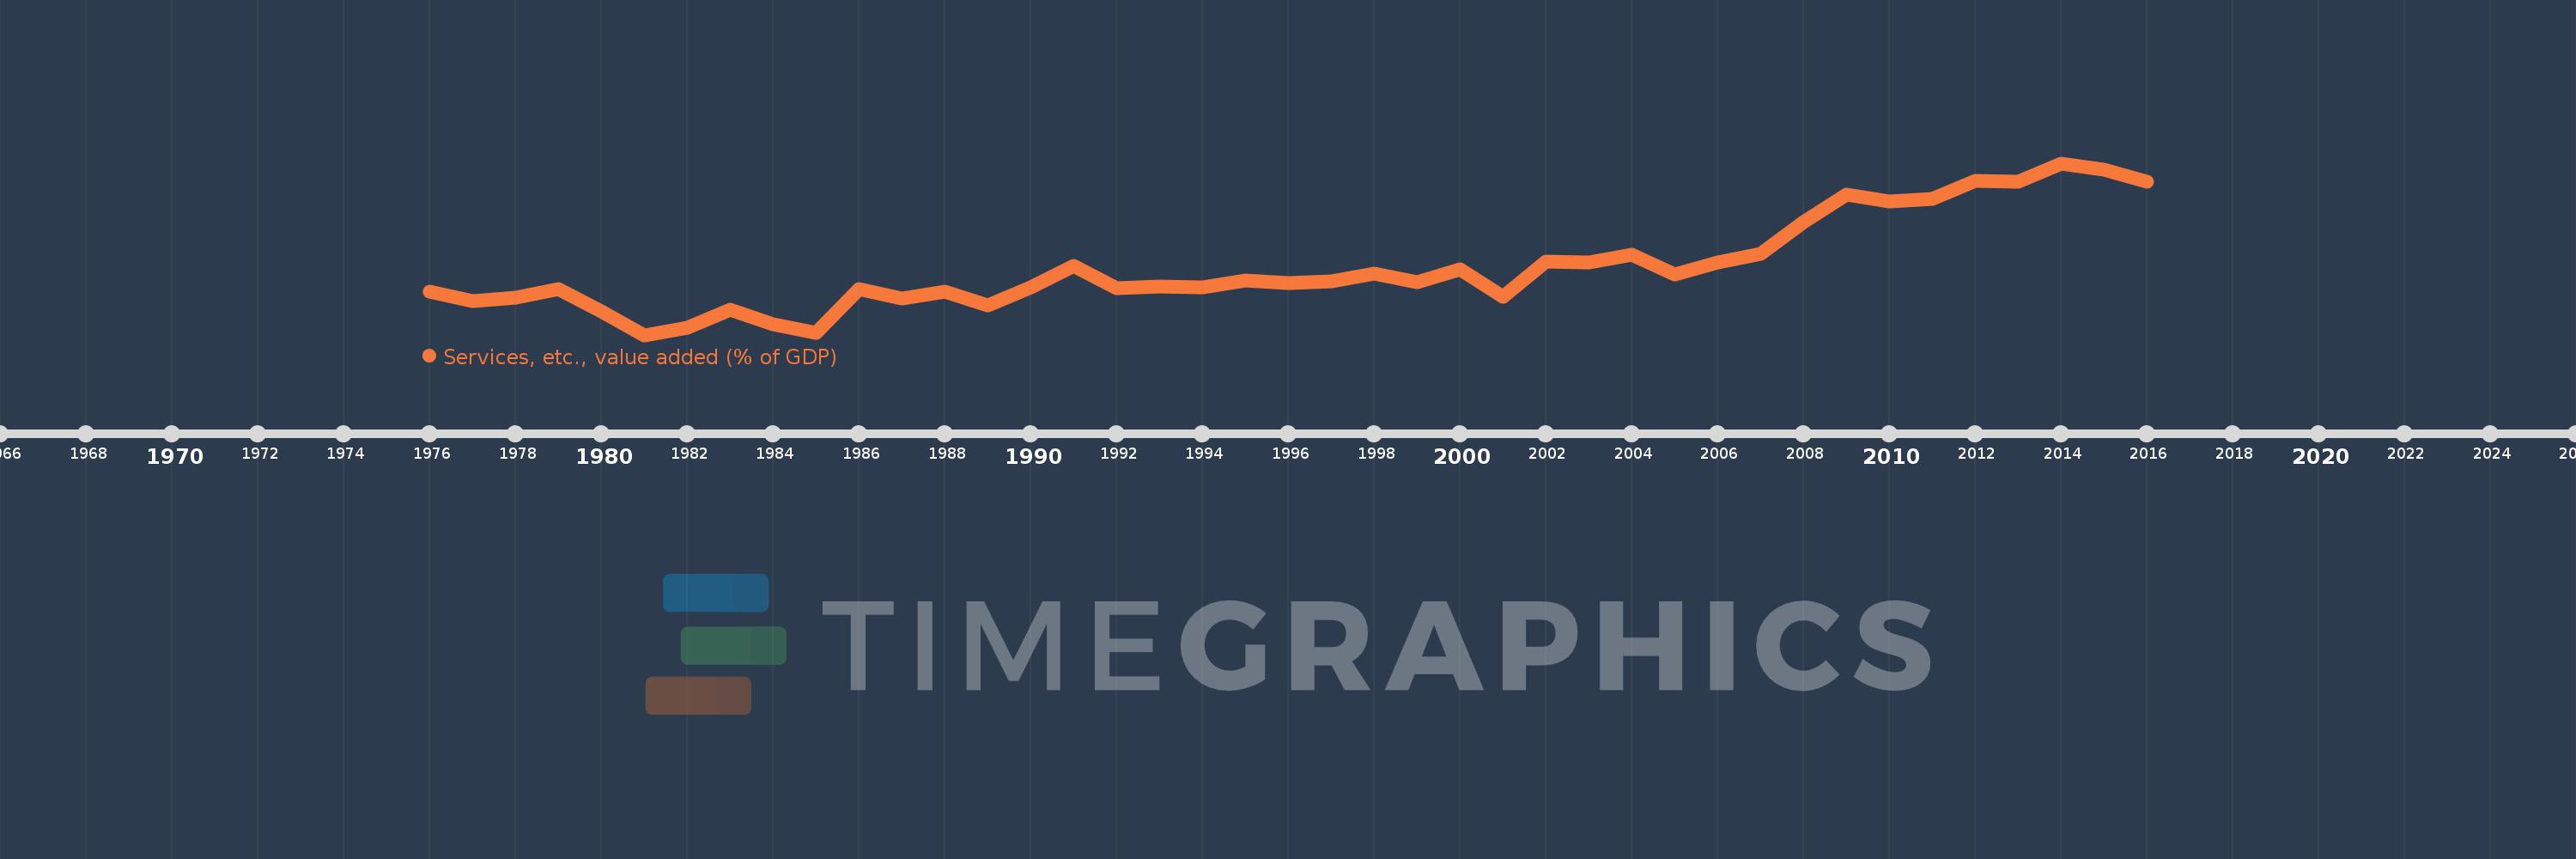
Services, etc., value added (% of GDP)
2016,2015,2014,2013,2012,2011,2010,2009,2008,2007,2006,2005,2004,2003,2002,2001,2000,1999,1998,1997,1996,1995,1994,1993,1992,1991,1990,1989,1988,1987,1986,1985,1984,1983,1982,1981,1980,1979,1978,1977,1976
Estas estatísticas em outros países:
AfghanistanAlbaniaAlgeriaAndorraAngolaAntigua and BarbudaArab WorldArgentinaArmeniaArubaAustraliaAustriaAzerbaijanBahamas, TheBahrainBangladeshBarbadosBelarusBelgiumBelizeBeninBermudaBhutanBoliviaBosnia and HerzegovinaBotswanaBrazilBrunei DarussalamBulgariaBurkina FasoBurundiCabo VerdeCambodiaCameroonCanadaCaribbean small statesCentral African RepublicCentral Europe and the BalticsChadChileChinaColombiaComorosCongo, Dem. Rep.Congo, Rep.Costa RicaCote d'IvoireCroatiaCubaCyprusCzech RepublicDenmarkDjiboutiDominicaDominican RepublicEarly-demographic dividendEast Asia & PacificEast Asia & Pacific (excluding high income)East Asia & Pacific (IDA & IBRD countries)EcuadorEgypt, Arab Rep.El SalvadorEquatorial GuineaEritreaEstoniaEthiopiaEuro areaEurope & Central AsiaEurope & Central Asia (excluding high income)Europe & Central Asia (IDA & IBRD countries)European UnionFaroe IslandsFijiFinlandFragile and conflict affected situationsFranceGabonGambia, TheGeorgiaGermanyGhanaGreeceGrenadaGuatemalaGuineaGuinea-BissauGuyanaHeavily indebted poor countries (HIPC)High incomeHondurasHong Kong SAR, ChinaHungaryIBRD onlyIcelandIDA & IBRD totalIDA blendIDA onlyIDA totalIndiaIndonesiaIran, Islamic Rep.IrelandItalyJamaicaJapanJordanKazakhstanKenyaKiribatiKorea, Rep.KosovoKuwaitKyrgyz RepublicLao PDRLate-demographic dividendLatin America & Caribbean Latin America & Caribbean (excluding high income)Latin America & the Caribbean (IDA & IBRD countries)LatviaLeast developed countries: UN classificationLebanonLesothoLibyaLithuaniaLow & middle incomeLow incomeLower middle incomeLuxembourgMacao SAR, ChinaMacedonia, FYRMadagascarMalawiMalaysiaMaldivesMaliMaltaMarshall IslandsMauritaniaMauritiusMexicoMicronesia, Fed. Sts.Middle East & North AfricaMiddle East & North Africa (excluding high income)Middle East & North Africa (IDA & IBRD countries)Middle incomeMoldovaMongoliaMontenegroMoroccoMozambiqueMyanmarNamibiaNepalNetherlandsNew CaledoniaNew ZealandNicaraguaNigerNigeriaNorth AmericaNorwayOECD membersOmanOther small statesPacific island small statesPakistanPalauPanamaPapua New GuineaParaguayPeruPhilippinesPolandPortugalPost-demographic dividendPre-demographic dividendPuerto RicoQatarRomaniaRussian FederationRwandaSao Tome and PrincipeSaudi ArabiaSenegalSerbiaSeychellesSierra LeoneSingaporeSlovak RepublicSloveniaSmall statesSolomon IslandsSomaliaSouth AfricaSouth AsiaSouth Asia (IDA & IBRD)SpainSri LankaSt. Kitts and NevisSt. LuciaSt. Vincent and the GrenadinesSub-Saharan Africa Sub-Saharan Africa (excluding high income)Sub-Saharan Africa (IDA & IBRD countries)SudanSurinameSwazilandSwedenSwitzerlandSyrian Arab RepublicTajikistanTanzaniaThailandTimor-LesteTogoTongaTrinidad and TobagoTunisiaTurkeyTurkmenistanTuvaluUgandaUkraineUnited KingdomUnited StatesUpper middle incomeUruguayUzbekistanVanuatuVenezuela, RBVietnamWest Bank and GazaWorldYemen, Rep.ZambiaZimbabwe Linha do tempo:
Nesta escala de tempo está apresentado um gráfico de 1976 ano até 2016 ano Singapore. Dados de 1975 ano ausente. O número de observações reais por data: 41.
Fonte (nome):
Indicadores de desenvolvimento mundial
Fonte (organização):
World Bank national accounts data, and OECD National Accounts data files.
Categorias:
Economy & Growth
Foi atualizado:
23 abr 2017 ano
Indicadores de alterações dos valores ao longo dos anos
Mínimo:
62.205
1 jan 1981 ano
Máximo:
74.951
1 jan 2014 ano
Na data de observação
Valor
Mudança absoluta
A alteração em relação ao valor anterior
1 jan 1976 ano
65.409
+65.409
0.0%
1 jan 1977 ano
64.72
-0.69
-1.05%
1 jan 1978 ano
64.957
+0.237
0.37%
1 jan 1979 ano
65.633
+0.676
1.04%
1 jan 1980 ano
63.97
-1.663
-2.53%
1 jan 1981 ano
62.205
-1.765
-2.76%
1 jan 1982 ano
62.764
+0.559
0.9%
1 jan 1983 ano
64.059
+1.296
2.06%
1 jan 1984 ano
63.015
-1.045
-1.63%
1 jan 1985 ano
62.353
-0.661
-1.05%
1 jan 1986 ano
65.599
+3.245
5.2%
1 jan 1987 ano
64.901
-0.698
-1.06%
1 jan 1988 ano
65.446
+0.545
0.84%
1 jan 1989 ano
64.395
-1.051
-1.61%
1 jan 1990 ano
65.729
+1.334
2.07%
1 jan 1991 ano
67.32
+1.591
2.42%
1 jan 1992 ano
65.671
-1.65
-2.45%
1 jan 1993 ano
65.811
+0.14
0.21%
1 jan 1994 ano
65.763
-0.047
-0.07%
1 jan 1995 ano
66.282
+0.518
0.79%
1 jan 1996 ano
66.09
-0.191
-0.29%
1 jan 1997 ano
66.214
+0.124
0.19%
1 jan 1998 ano
66.771
+0.556
0.84%
1 jan 1999 ano
66.118
-0.652
-0.98%
1 jan 2000 ano
67.096
+0.978
1.48%
1 jan 2001 ano
65.067
-2.029
-3.02%
1 jan 2002 ano
67.632
+2.565
3.94%
1 jan 2003 ano
67.605
-0.027
-0.04%
1 jan 2004 ano
68.175
+0.569
0.84%
1 jan 2005 ano
66.667
-1.508
-2.21%
1 jan 2006 ano
67.581
+0.914
1.37%
1 jan 2007 ano
68.235
+0.654
0.97%
1 jan 2008 ano
70.606
+2.37
3.47%
1 jan 2009 ano
72.629
+2.023
2.87%
1 jan 2010 ano
72.089
-0.54
-0.74%
1 jan 2011 ano
72.332
+0.242
0.34%
1 jan 2012 ano
73.66
+1.328
1.84%
1 jan 2013 ano
73.573
-0.087
-0.12%
1 jan 2014 ano
74.951
+1.378
1.87%
1 jan 2015 ano
74.502
-0.449
-0.6%
1 jan 2016 ano
73.561
-0.941
-1.26%
Classificação de países por estatísticas atuais por anos


Comentários: