29
/pt/
pt
AIzaSyAYiBZKx7MnpbEhh9jyipgxe19OcubqV5w
April 1, 2024
85281
Bermuda
BMU
true
2
1
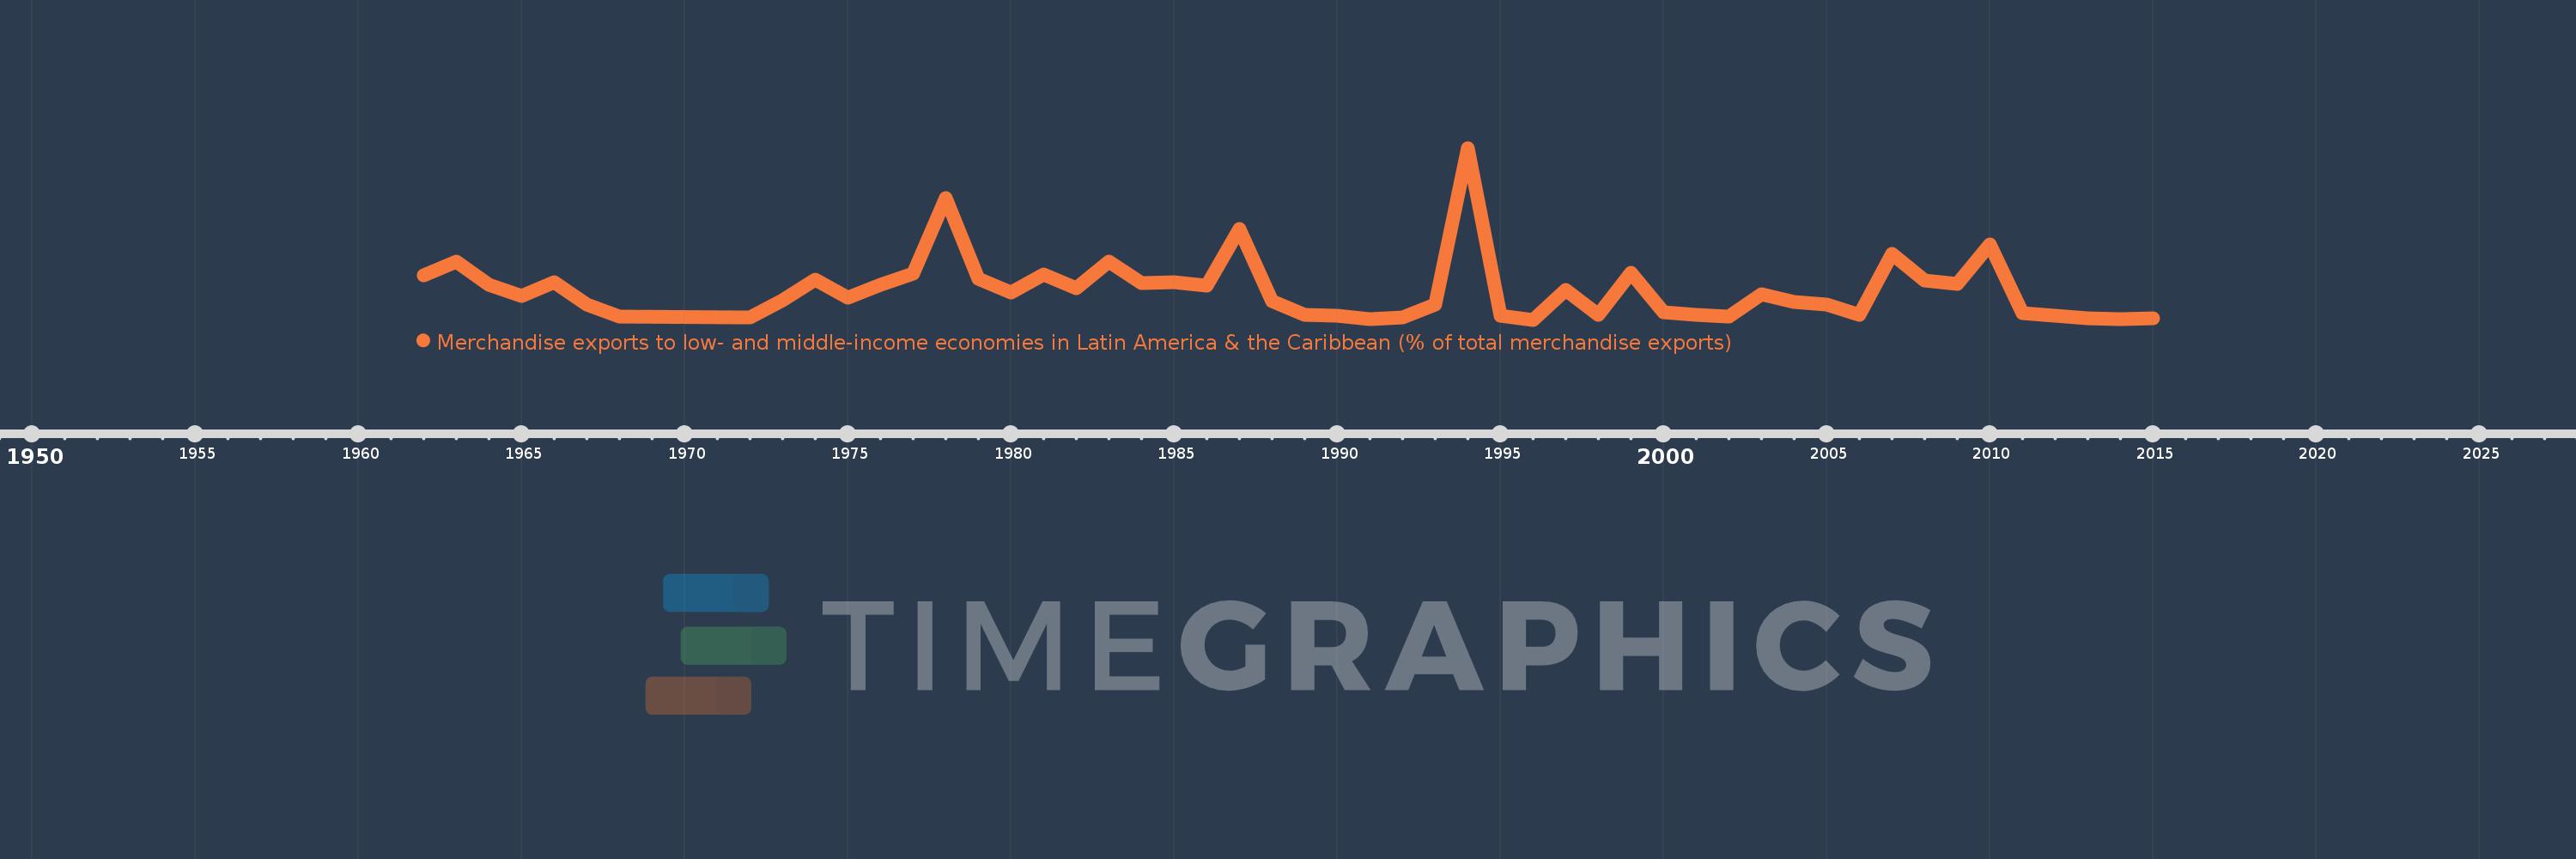
Merchandise exports to low- and middle-income economies in Latin America & the Caribbean (% of total merchandise exports)
2015,2014,2013,2012,2011,2010,2009,2008,2007,2006,2005,2004,2003,2002,2001,2000,1999,1998,1997,1996,1995,1994,1993,1992,1991,1990,1989,1988,1987,1986,1985,1984,1983,1982,1981,1980,1979,1978,1977,1976,1975,1974,1973,1972,1968,1967,1966,1965,1964,1963,1962
Estas estatísticas em outros países:
AfghanistanAlbaniaAlgeriaAngolaAntigua and BarbudaArab WorldArgentinaArmeniaArubaAustraliaAustriaAzerbaijanBahamas, TheBahrainBangladeshBarbadosBelarusBelgiumBelizeBeninBermudaBoliviaBrazilBrunei DarussalamBulgariaBurundiCabo VerdeCambodiaCameroonCanadaCaribbean small statesCentral African RepublicCentral Europe and the BalticsChileChinaColombiaCongo, Dem. Rep.Congo, Rep.Costa RicaCote d'IvoireCroatiaCubaCyprusCzech RepublicDenmarkDominicaDominican RepublicEarly-demographic dividendEast Asia & PacificEast Asia & Pacific (excluding high income)East Asia & Pacific (IDA & IBRD countries)EcuadorEgypt, Arab Rep.El SalvadorEstoniaEthiopiaEuro areaEurope & Central AsiaEurope & Central Asia (excluding high income)Europe & Central Asia (IDA & IBRD countries)European UnionFaroe IslandsFijiFinlandFragile and conflict affected situationsFranceFrench PolynesiaGabonGambia, TheGeorgiaGermanyGhanaGibraltarGreeceGreenlandGrenadaGuatemalaGuineaGuyanaHaitiHeavily indebted poor countries (HIPC)High incomeHondurasHong Kong SAR, ChinaHungaryIBRD onlyIcelandIDA & IBRD totalIDA blendIDA onlyIDA totalIndiaIndonesiaIran, Islamic Rep.IraqIrelandIsraelItalyJamaicaJapanJordanKazakhstanKenyaKorea, Dem. People’s Rep.Korea, Rep.KuwaitLao PDRLate-demographic dividendLatin America & Caribbean Latin America & Caribbean (excluding high income)Latin America & the Caribbean (IDA & IBRD countries)LatviaLeast developed countries: UN classificationLebanonLiberiaLibyaLithuaniaLow & middle incomeLow incomeLower middle incomeLuxembourgMacao SAR, ChinaMacedonia, FYRMadagascarMalawiMalaysiaMaliMaltaMauritaniaMauritiusMexicoMiddle East & North AfricaMiddle East & North Africa (excluding high income)Middle East & North Africa (IDA & IBRD countries)Middle incomeMongoliaMontenegroMoroccoMozambiqueMyanmarNetherlandsNew CaledoniaNew ZealandNicaraguaNigerNigeriaNorth AmericaNorwayOECD membersOmanOther small statesPacific island small statesPakistanPanamaPapua New GuineaParaguayPeruPhilippinesPolandPortugalPost-demographic dividendPre-demographic dividendQatarRomaniaRussian FederationRwandaSamoaSaudi ArabiaSenegalSerbiaSierra LeoneSingaporeSlovak RepublicSloveniaSmall statesSomaliaSouth AfricaSouth AsiaSouth Asia (IDA & IBRD)SpainSri LankaSt. Kitts and NevisSt. LuciaSt. Vincent and the GrenadinesSub-Saharan Africa Sub-Saharan Africa (excluding high income)Sub-Saharan Africa (IDA & IBRD countries)SudanSurinameSwedenSwitzerlandSyrian Arab RepublicTanzaniaThailandTogoTrinidad and TobagoTunisiaTurkeyUgandaUkraineUnited Arab EmiratesUnited KingdomUnited StatesUpper middle incomeUruguayVenezuela, RBVietnamWorldYemen, Rep.ZambiaZimbabwe Linha do tempo:
Nesta escala de tempo está apresentado um gráfico de 1962 ano até 2015 ano Bermuda. Dados de 1961 ano ausente. O número de observações reais por data: 51.
Fonte (nome):
Indicadores de desenvolvimento mundial
Fonte (organização):
World Bank staff estimates based data from International Monetary Fund's Direction of Trade database.
Categorias:
Private Sector, Trade
Foi atualizado:
23 abr 2017 ano
Indicadores de alterações dos valores ao longo dos anos
Máximo:
29.609
1 jan 1994 ano
Na data de observação
Valor
Mudança absoluta
A alteração em relação ao valor anterior
1 jan 1962 ano
7.634
+7.634
0.0%
1 jan 1963 ano
10.039
+2.405
31.51%
1 jan 1964 ano
5.974
-4.065
-40.49%
1 jan 1965 ano
4.076
-1.898
-31.77%
1 jan 1966 ano
6.399
+2.322
56.98%
1 jan 1967 ano
2.617
-3.782
-59.1%
1 jan 1968 ano
0.498
-2.118
-80.96%
1 jan 1972 ano
0.465
-0.033
-6.66%
1 jan 1973 ano
3.3
+2.835
609.37%
1 jan 1974 ano
6.919
+3.619
109.67%
1 jan 1975 ano
3.776
-3.143
-45.43%
1 jan 1976 ano
6.074
+2.299
60.88%
1 jan 1977 ano
7.992
+1.918
31.57%
1 jan 1978 ano
20.953
+12.961
162.18%
1 jan 1979 ano
7.031
-13.922
-66.45%
1 jan 1980 ano
4.644
-2.387
-33.94%
1 jan 1981 ano
7.866
+3.222
69.37%
1 jan 1982 ano
5.475
-2.39
-30.39%
1 jan 1983 ano
9.97
+4.494
82.09%
1 jan 1984 ano
6.349
-3.621
-36.32%
1 jan 1985 ano
6.47
+0.121
1.9%
1 jan 1986 ano
5.912
-0.558
-8.62%
1 jan 1987 ano
15.708
+9.796
165.7%
1 jan 1988 ano
3.215
-12.493
-79.53%
1 jan 1989 ano
0.774
-2.441
-75.92%
1 jan 1990 ano
0.684
-0.09
-11.63%
1 jan 1991 ano
0.12
-0.564
-82.47%
1 jan 1992 ano
0.352
+0.232
193.48%
1 jan 1993 ano
2.685
+2.333
663.17%
1 jan 1994 ano
29.609
+26.924
1.0 mil%
1 jan 1995 ano
0.687
-28.922
-97.68%
1 jan 1996 ano
0.0
-0.687
-99.99%
1 jan 1997 ano
5.114
+5.114
6.19 milhões%
1 jan 1998 ano
0.862
-4.252
-83.15%
1 jan 1999 ano
8.099
+7.237
840.04%
1 jan 2000 ano
1.351
-6.748
-83.32%
1 jan 2001 ano
0.83
-0.521
-38.53%
1 jan 2002 ano
0.502
-0.328
-39.5%
1 jan 2003 ano
4.36
+3.857
767.74%
1 jan 2004 ano
3.056
-1.304
-29.9%
1 jan 2005 ano
2.63
-0.426
-13.95%
1 jan 2006 ano
0.864
-1.766
-67.13%
1 jan 2007 ano
11.317
+10.453
1.21 mil%
1 jan 2008 ano
6.798
-4.519
-39.93%
1 jan 2009 ano
6.139
-0.659
-9.7%
1 jan 2010 ano
12.948
+6.809
110.92%
1 jan 2011 ano
1.165
-11.783
-91.0%
1 jan 2012 ano
0.732
-0.434
-37.2%
1 jan 2013 ano
0.272
-0.46
-62.82%
1 jan 2014 ano
0.136
-0.137
-50.19%
1 jan 2015 ano
0.315
+0.18
132.47%
Classificação de países por estatísticas atuais por anos


Comentários: