29
/pt/
pt
AIzaSyAYiBZKx7MnpbEhh9jyipgxe19OcubqV5w
April 1, 2024
37545
IDA & IBRD total
IBT
false
2
1
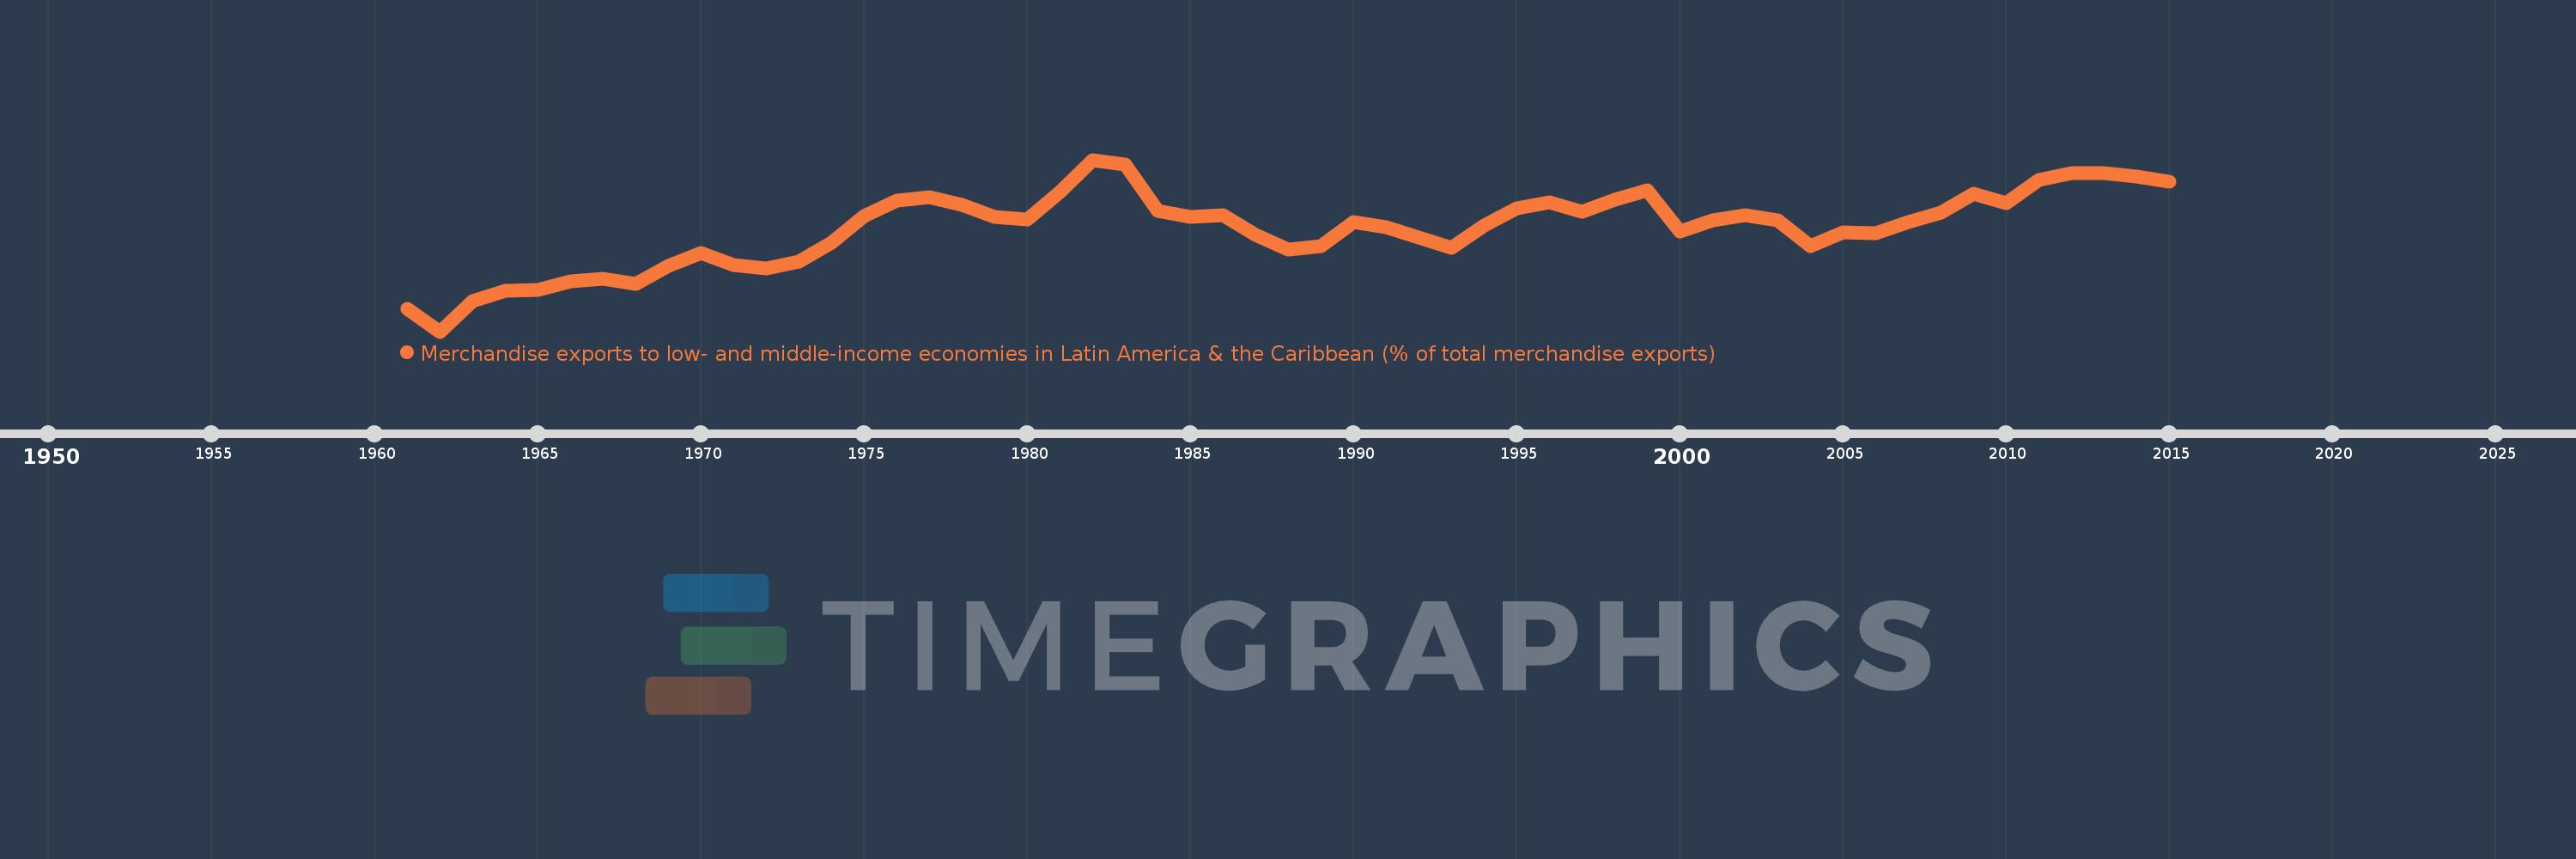
Merchandise exports to low- and middle-income economies in Latin America & the Caribbean (% of total merchandise exports)
2015,2014,2013,2012,2011,2010,2009,2008,2007,2006,2005,2004,2003,2002,2001,2000,1999,1998,1997,1996,1995,1994,1993,1992,1991,1990,1989,1988,1987,1986,1985,1984,1983,1982,1981,1980,1979,1978,1977,1976,1975,1974,1973,1972,1971,1970,1969,1968,1967,1966,1965,1964,1963,1962,1961
Estas estatísticas em outros países:
AfghanistanAlbaniaAlgeriaAngolaAntigua and BarbudaArab WorldArgentinaArmeniaArubaAustraliaAustriaAzerbaijanBahamas, TheBahrainBangladeshBarbadosBelarusBelgiumBelizeBeninBermudaBoliviaBrazilBrunei DarussalamBulgariaBurundiCabo VerdeCambodiaCameroonCanadaCaribbean small statesCentral African RepublicCentral Europe and the BalticsChileChinaColombiaCongo, Dem. Rep.Congo, Rep.Costa RicaCote d'IvoireCroatiaCubaCyprusCzech RepublicDenmarkDominicaDominican RepublicEarly-demographic dividendEast Asia & PacificEast Asia & Pacific (excluding high income)East Asia & Pacific (IDA & IBRD countries)EcuadorEgypt, Arab Rep.El SalvadorEstoniaEthiopiaEuro areaEurope & Central AsiaEurope & Central Asia (excluding high income)Europe & Central Asia (IDA & IBRD countries)European UnionFaroe IslandsFijiFinlandFragile and conflict affected situationsFranceFrench PolynesiaGabonGambia, TheGeorgiaGermanyGhanaGibraltarGreeceGreenlandGrenadaGuatemalaGuineaGuyanaHaitiHeavily indebted poor countries (HIPC)High incomeHondurasHong Kong SAR, ChinaHungaryIBRD onlyIcelandIDA & IBRD totalIDA blendIDA onlyIDA totalIndiaIndonesiaIran, Islamic Rep.IraqIrelandIsraelItalyJamaicaJapanJordanKazakhstanKenyaKorea, Dem. People’s Rep.Korea, Rep.KuwaitLao PDRLate-demographic dividendLatin America & Caribbean Latin America & Caribbean (excluding high income)Latin America & the Caribbean (IDA & IBRD countries)LatviaLeast developed countries: UN classificationLebanonLiberiaLibyaLithuaniaLow & middle incomeLow incomeLower middle incomeLuxembourgMacao SAR, ChinaMacedonia, FYRMadagascarMalawiMalaysiaMaliMaltaMauritaniaMauritiusMexicoMiddle East & North AfricaMiddle East & North Africa (excluding high income)Middle East & North Africa (IDA & IBRD countries)Middle incomeMongoliaMontenegroMoroccoMozambiqueMyanmarNetherlandsNew CaledoniaNew ZealandNicaraguaNigerNigeriaNorth AmericaNorwayOECD membersOmanOther small statesPacific island small statesPakistanPanamaPapua New GuineaParaguayPeruPhilippinesPolandPortugalPost-demographic dividendPre-demographic dividendQatarRomaniaRussian FederationRwandaSamoaSaudi ArabiaSenegalSerbiaSierra LeoneSingaporeSlovak RepublicSloveniaSmall statesSomaliaSouth AfricaSouth AsiaSouth Asia (IDA & IBRD)SpainSri LankaSt. Kitts and NevisSt. LuciaSt. Vincent and the GrenadinesSub-Saharan Africa Sub-Saharan Africa (excluding high income)Sub-Saharan Africa (IDA & IBRD countries)SudanSurinameSwedenSwitzerlandSyrian Arab RepublicTanzaniaThailandTogoTrinidad and TobagoTunisiaTurkeyUgandaUkraineUnited Arab EmiratesUnited KingdomUnited StatesUpper middle incomeUruguayVenezuela, RBVietnamWorldYemen, Rep.ZambiaZimbabwe Linha do tempo:
Nesta escala de tempo está apresentado um gráfico de 1961 ano até 2015 ano IDA & IBRD total. Dados de 1960 ano ausente. O número de observações reais por data: 55.
Fonte (nome):
Indicadores de desenvolvimento mundial
Fonte (organização):
World Bank staff estimates based data from International Monetary Fund's Direction of Trade database.
Categorias:
Private Sector, Trade
Foi atualizado:
23 abr 2017 ano
Indicadores de alterações dos valores ao longo dos anos
Mínimo:
1.838
1 jan 1962 ano
Máximo:
4.784
1 jan 1982 ano
Na data de observação
Valor
Mudança absoluta
A alteração em relação ao valor anterior
1 jan 1961 ano
2.234
+2.234
0.0%
1 jan 1962 ano
1.838
-0.396
-17.74%
1 jan 1963 ano
2.364
+0.526
28.62%
1 jan 1964 ano
2.545
+0.181
7.66%
1 jan 1965 ano
2.547
+0.003
0.11%
1 jan 1966 ano
2.703
+0.156
6.12%
1 jan 1967 ano
2.74
+0.036
1.34%
1 jan 1968 ano
2.652
-0.088
-3.21%
1 jan 1969 ano
2.96
+0.308
11.63%
1 jan 1970 ano
3.187
+0.227
7.67%
1 jan 1971 ano
2.976
-0.211
-6.61%
1 jan 1972 ano
2.915
-0.061
-2.06%
1 jan 1973 ano
3.043
+0.128
4.38%
1 jan 1974 ano
3.359
+0.316
10.38%
1 jan 1975 ano
3.824
+0.465
13.85%
1 jan 1976 ano
4.081
+0.257
6.73%
1 jan 1977 ano
4.139
+0.058
1.41%
1 jan 1978 ano
4.011
-0.128
-3.1%
1 jan 1979 ano
3.8
-0.211
-5.26%
1 jan 1980 ano
3.767
-0.033
-0.86%
1 jan 1981 ano
4.231
+0.464
12.32%
1 jan 1982 ano
4.784
+0.553
13.06%
1 jan 1983 ano
4.702
-0.082
-1.71%
1 jan 1984 ano
3.911
-0.791
-16.81%
1 jan 1985 ano
3.801
-0.111
-2.83%
1 jan 1986 ano
3.83
+0.03
0.78%
1 jan 1987 ano
3.494
-0.336
-8.78%
1 jan 1988 ano
3.239
-0.255
-7.29%
1 jan 1989 ano
3.302
+0.063
1.95%
1 jan 1990 ano
3.709
+0.407
12.32%
1 jan 1991 ano
3.623
-0.086
-2.32%
1 jan 1992 ano
3.444
-0.18
-4.96%
1 jan 1993 ano
3.273
-0.171
-4.96%
1 jan 1994 ano
3.657
+0.384
11.72%
1 jan 1995 ano
3.959
+0.302
8.26%
1 jan 1996 ano
4.057
+0.098
2.48%
1 jan 1997 ano
3.888
-0.169
-4.16%
1 jan 1998 ano
4.104
+0.216
5.56%
1 jan 1999 ano
4.262
+0.158
3.86%
1 jan 2000 ano
3.557
-0.706
-16.56%
1 jan 2001 ano
3.746
+0.19
5.34%
1 jan 2002 ano
3.829
+0.083
2.22%
1 jan 2003 ano
3.751
-0.079
-2.05%
1 jan 2004 ano
3.31
-0.441
-11.76%
1 jan 2005 ano
3.534
+0.224
6.78%
1 jan 2006 ano
3.524
-0.01
-0.29%
1 jan 2007 ano
3.722
+0.199
5.63%
1 jan 2008 ano
3.88
+0.158
4.25%
1 jan 2009 ano
4.196
+0.316
8.14%
1 jan 2010 ano
4.044
-0.152
-3.62%
1 jan 2011 ano
4.435
+0.391
9.66%
1 jan 2012 ano
4.549
+0.114
2.57%
1 jan 2013 ano
4.563
+0.014
0.31%
1 jan 2014 ano
4.496
-0.067
-1.47%
1 jan 2015 ano
4.411
-0.085
-1.89%
Classificação de países por estatísticas atuais por anos


Comentários: