29
/pt/
pt
AIzaSyAYiBZKx7MnpbEhh9jyipgxe19OcubqV5w
April 1, 2024
38342
IDA blend
IDB
false
2
1
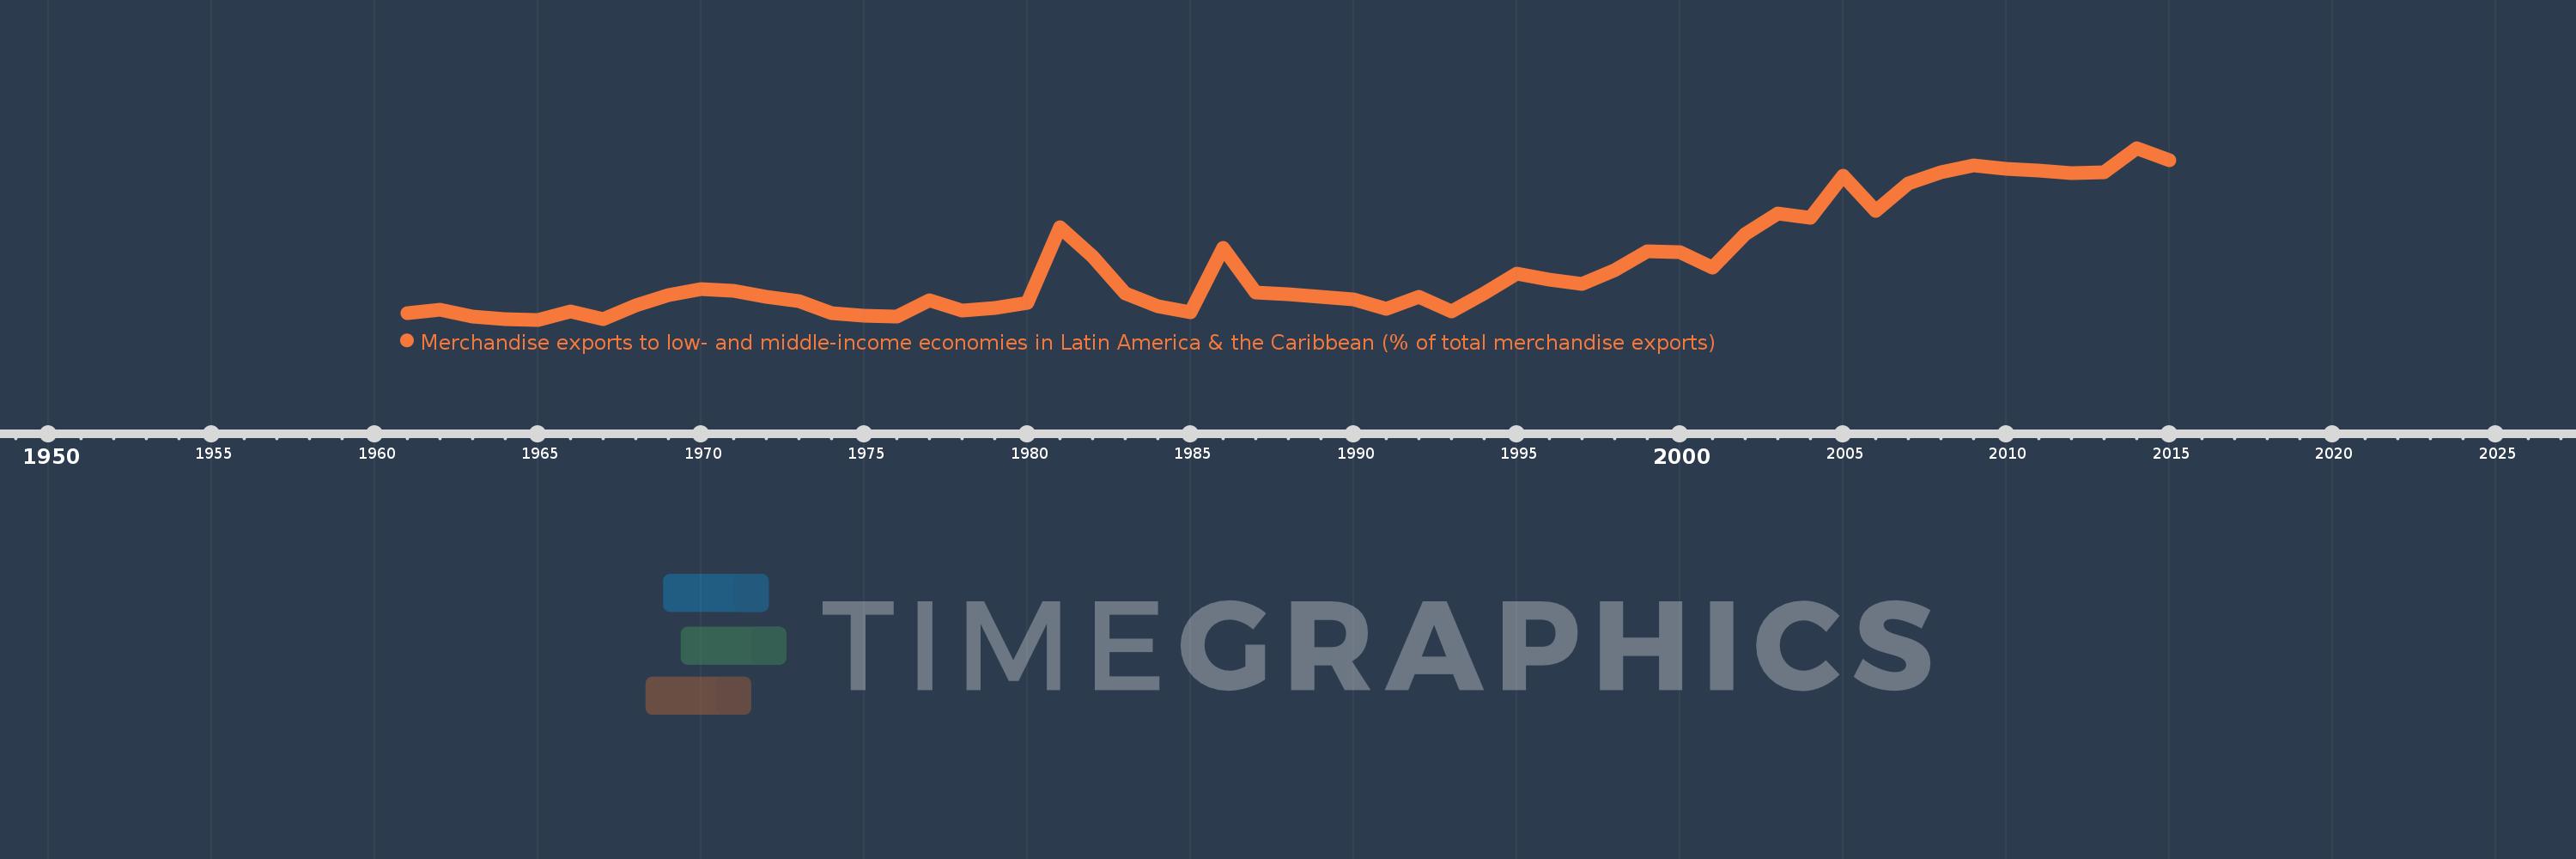
Merchandise exports to low- and middle-income economies in Latin America & the Caribbean (% of total merchandise exports)
2015,2014,2013,2012,2011,2010,2009,2008,2007,2006,2005,2004,2003,2002,2001,2000,1999,1998,1997,1996,1995,1994,1993,1992,1991,1990,1989,1988,1987,1986,1985,1984,1983,1982,1981,1980,1979,1978,1977,1976,1975,1974,1973,1972,1971,1970,1969,1968,1967,1966,1965,1964,1963,1962,1961
Estas estatísticas em outros países:
AfghanistanAlbaniaAlgeriaAngolaAntigua and BarbudaArab WorldArgentinaArmeniaArubaAustraliaAustriaAzerbaijanBahamas, TheBahrainBangladeshBarbadosBelarusBelgiumBelizeBeninBermudaBoliviaBrazilBrunei DarussalamBulgariaBurundiCabo VerdeCambodiaCameroonCanadaCaribbean small statesCentral African RepublicCentral Europe and the BalticsChileChinaColombiaCongo, Dem. Rep.Congo, Rep.Costa RicaCote d'IvoireCroatiaCubaCyprusCzech RepublicDenmarkDominicaDominican RepublicEarly-demographic dividendEast Asia & PacificEast Asia & Pacific (excluding high income)East Asia & Pacific (IDA & IBRD countries)EcuadorEgypt, Arab Rep.El SalvadorEstoniaEthiopiaEuro areaEurope & Central AsiaEurope & Central Asia (excluding high income)Europe & Central Asia (IDA & IBRD countries)European UnionFaroe IslandsFijiFinlandFragile and conflict affected situationsFranceFrench PolynesiaGabonGambia, TheGeorgiaGermanyGhanaGibraltarGreeceGreenlandGrenadaGuatemalaGuineaGuyanaHaitiHeavily indebted poor countries (HIPC)High incomeHondurasHong Kong SAR, ChinaHungaryIBRD onlyIcelandIDA & IBRD totalIDA blendIDA onlyIDA totalIndiaIndonesiaIran, Islamic Rep.IraqIrelandIsraelItalyJamaicaJapanJordanKazakhstanKenyaKorea, Dem. People’s Rep.Korea, Rep.KuwaitLao PDRLate-demographic dividendLatin America & Caribbean Latin America & Caribbean (excluding high income)Latin America & the Caribbean (IDA & IBRD countries)LatviaLeast developed countries: UN classificationLebanonLiberiaLibyaLithuaniaLow & middle incomeLow incomeLower middle incomeLuxembourgMacao SAR, ChinaMacedonia, FYRMadagascarMalawiMalaysiaMaliMaltaMauritaniaMauritiusMexicoMiddle East & North AfricaMiddle East & North Africa (excluding high income)Middle East & North Africa (IDA & IBRD countries)Middle incomeMongoliaMontenegroMoroccoMozambiqueMyanmarNetherlandsNew CaledoniaNew ZealandNicaraguaNigerNigeriaNorth AmericaNorwayOECD membersOmanOther small statesPacific island small statesPakistanPanamaPapua New GuineaParaguayPeruPhilippinesPolandPortugalPost-demographic dividendPre-demographic dividendQatarRomaniaRussian FederationRwandaSamoaSaudi ArabiaSenegalSerbiaSierra LeoneSingaporeSlovak RepublicSloveniaSmall statesSomaliaSouth AfricaSouth AsiaSouth Asia (IDA & IBRD)SpainSri LankaSt. Kitts and NevisSt. LuciaSt. Vincent and the GrenadinesSub-Saharan Africa Sub-Saharan Africa (excluding high income)Sub-Saharan Africa (IDA & IBRD countries)SudanSurinameSwedenSwitzerlandSyrian Arab RepublicTanzaniaThailandTogoTrinidad and TobagoTunisiaTurkeyUgandaUkraineUnited Arab EmiratesUnited KingdomUnited StatesUpper middle incomeUruguayVenezuela, RBVietnamWorldYemen, Rep.ZambiaZimbabwe Linha do tempo:
Nesta escala de tempo está apresentado um gráfico de 1961 ano até 2015 ano IDA blend. Dados de 1960 ano ausente. O número de observações reais por data: 55.
Fonte (nome):
Indicadores de desenvolvimento mundial
Fonte (organização):
World Bank staff estimates based data from International Monetary Fund's Direction of Trade database.
Categorias:
Private Sector, Trade
Foi atualizado:
23 abr 2017 ano
Indicadores de alterações dos valores ao longo dos anos
Mínimo:
0.444
1 jan 1965 ano
Máximo:
6.28
1 jan 2014 ano
Na data de observação
Valor
Mudança absoluta
A alteração em relação ao valor anterior
1 jan 1961 ano
0.663
+0.663
0.0%
1 jan 1962 ano
0.796
+0.133
20.02%
1 jan 1963 ano
0.561
-0.235
-29.56%
1 jan 1964 ano
0.476
-0.084
-15.04%
1 jan 1965 ano
0.444
-0.032
-6.71%
1 jan 1966 ano
0.725
+0.281
63.16%
1 jan 1967 ano
0.45
-0.275
-37.93%
1 jan 1968 ano
0.918
+0.468
103.91%
1 jan 1969 ano
1.28
+0.362
39.47%
1 jan 1970 ano
1.483
+0.203
15.88%
1 jan 1971 ano
1.435
-0.049
-3.28%
1 jan 1972 ano
1.211
-0.224
-15.6%
1 jan 1973 ano
1.089
-0.122
-10.08%
1 jan 1974 ano
0.664
-0.425
-39.02%
1 jan 1975 ano
0.587
-0.077
-11.55%
1 jan 1976 ano
0.551
-0.036
-6.09%
1 jan 1977 ano
1.11
+0.558
101.26%
1 jan 1978 ano
0.763
-0.347
-31.23%
1 jan 1979 ano
0.837
+0.074
9.67%
1 jan 1980 ano
1.019
+0.182
21.79%
1 jan 1981 ano
3.577
+2.558
250.94%
1 jan 1982 ano
2.592
-0.985
-27.54%
1 jan 1983 ano
1.348
-1.244
-47.99%
1 jan 1984 ano
0.888
-0.46
-34.1%
1 jan 1985 ano
0.699
-0.189
-21.27%
1 jan 1986 ano
2.896
+2.196
313.97%
1 jan 1987 ano
1.375
-1.521
-52.52%
1 jan 1988 ano
1.316
-0.059
-4.26%
1 jan 1989 ano
1.215
-0.101
-7.67%
1 jan 1990 ano
1.127
-0.089
-7.28%
1 jan 1991 ano
0.806
-0.321
-28.48%
1 jan 1992 ano
1.215
+0.41
50.83%
1 jan 1993 ano
0.741
-0.475
-39.07%
1 jan 1994 ano
1.349
+0.609
82.22%
1 jan 1995 ano
1.997
+0.647
47.98%
1 jan 1996 ano
1.804
-0.193
-9.68%
1 jan 1997 ano
1.664
-0.14
-7.75%
1 jan 1998 ano
2.118
+0.454
27.31%
1 jan 1999 ano
2.78
+0.662
31.25%
1 jan 2000 ano
2.727
-0.053
-1.91%
1 jan 2001 ano
2.212
-0.515
-18.89%
1 jan 2002 ano
3.346
+1.135
51.3%
1 jan 2003 ano
4.068
+0.721
21.55%
1 jan 2004 ano
3.917
-0.151
-3.71%
1 jan 2005 ano
5.33
+1.413
36.08%
1 jan 2006 ano
4.127
-1.203
-22.57%
1 jan 2007 ano
5.073
+0.946
22.93%
1 jan 2008 ano
5.456
+0.383
7.54%
1 jan 2009 ano
5.69
+0.234
4.29%
1 jan 2010 ano
5.562
-0.128
-2.25%
1 jan 2011 ano
5.518
-0.044
-0.79%
1 jan 2012 ano
5.415
-0.103
-1.87%
1 jan 2013 ano
5.441
+0.026
0.48%
1 jan 2014 ano
6.28
+0.839
15.42%
1 jan 2015 ano
5.858
-0.422
-6.72%
Classificação de países por estatísticas atuais por anos


Comentários: