29
/pt/
pt
AIzaSyAYiBZKx7MnpbEhh9jyipgxe19OcubqV5w
April 1, 2024
251018
St. Lucia
LCA
true
2
1
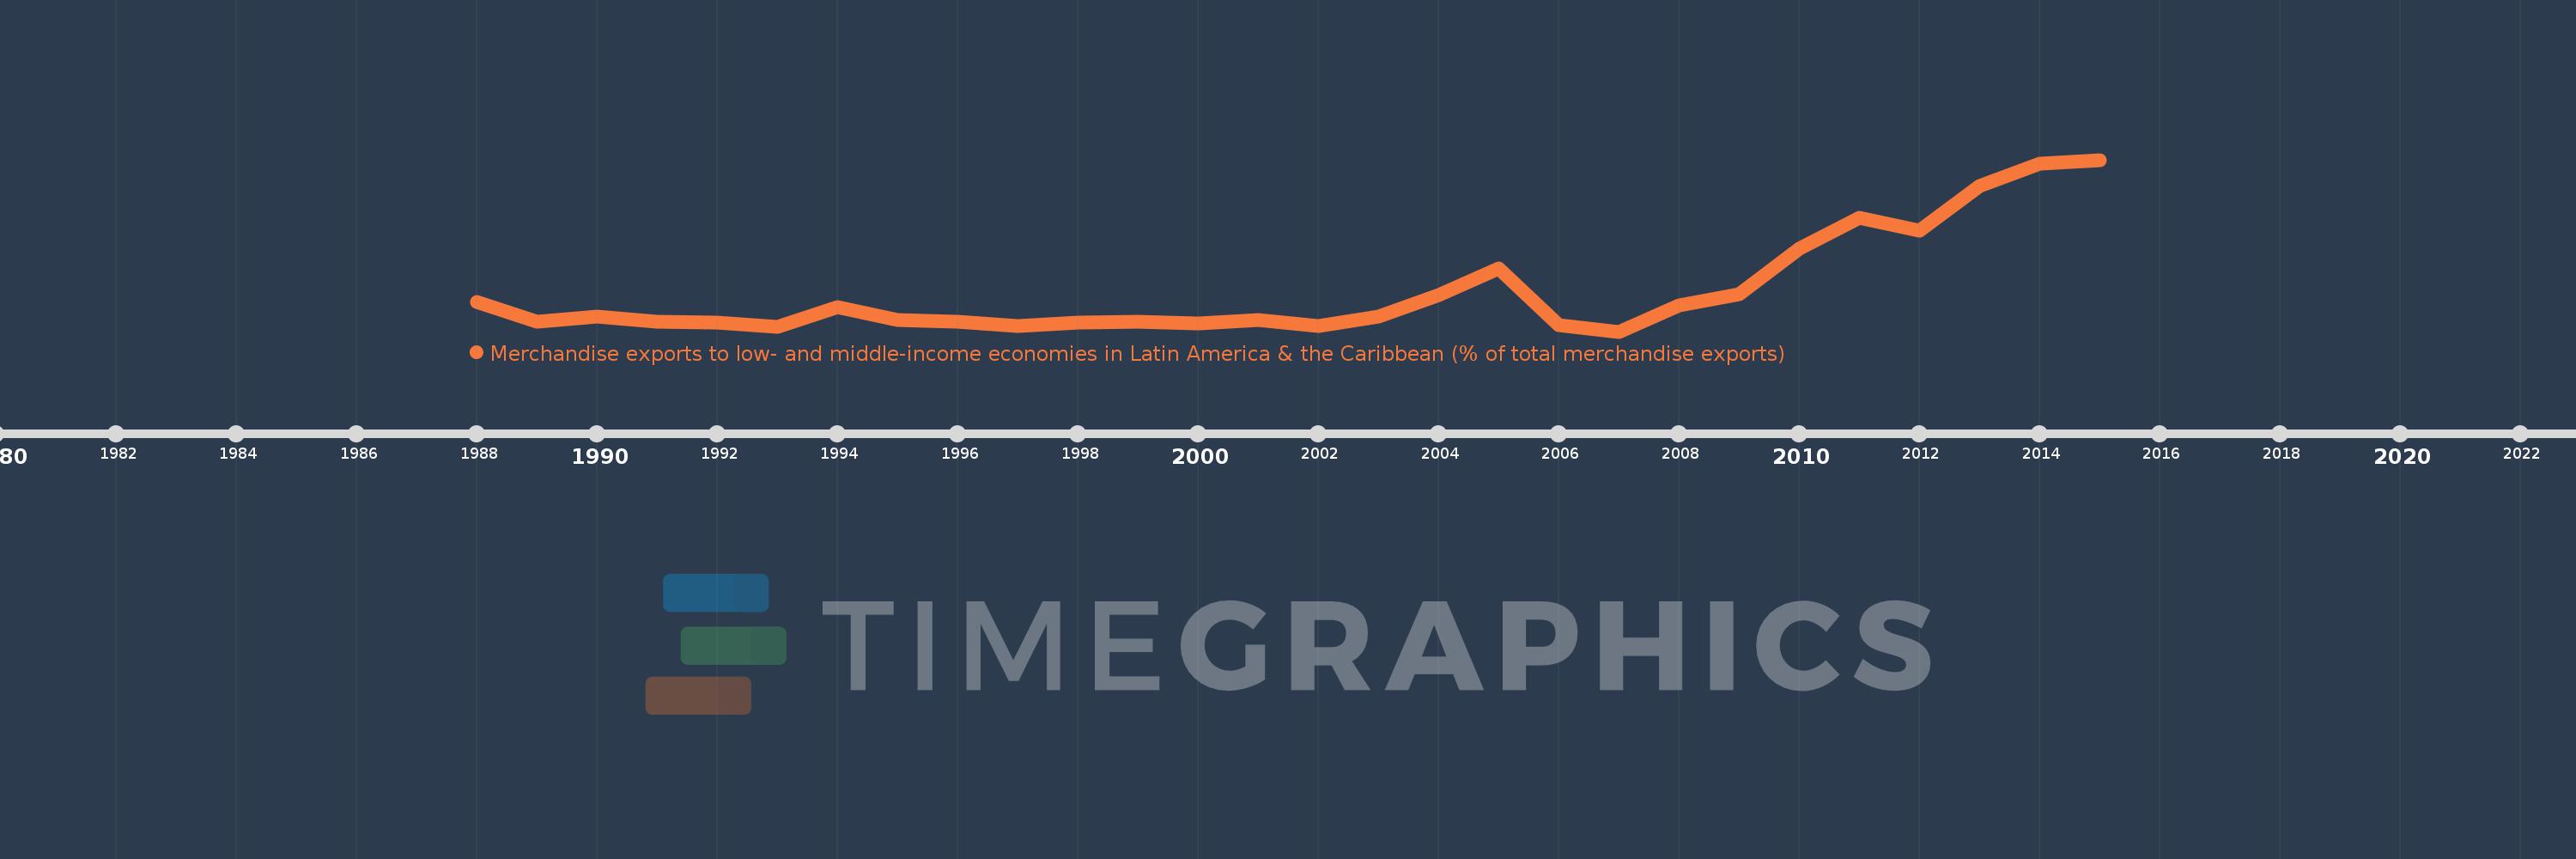
Merchandise exports to low- and middle-income economies in Latin America & the Caribbean (% of total merchandise exports)
2015,2014,2013,2012,2011,2010,2009,2008,2007,2006,2005,2004,2003,2002,2001,2000,1999,1998,1997,1996,1995,1994,1993,1992,1991,1990,1989,1988
Estas estatísticas em outros países:
AfghanistanAlbaniaAlgeriaAngolaAntigua and BarbudaArab WorldArgentinaArmeniaArubaAustraliaAustriaAzerbaijanBahamas, TheBahrainBangladeshBarbadosBelarusBelgiumBelizeBeninBermudaBoliviaBrazilBrunei DarussalamBulgariaBurundiCabo VerdeCambodiaCameroonCanadaCaribbean small statesCentral African RepublicCentral Europe and the BalticsChileChinaColombiaCongo, Dem. Rep.Congo, Rep.Costa RicaCote d'IvoireCroatiaCubaCyprusCzech RepublicDenmarkDominicaDominican RepublicEarly-demographic dividendEast Asia & PacificEast Asia & Pacific (excluding high income)East Asia & Pacific (IDA & IBRD countries)EcuadorEgypt, Arab Rep.El SalvadorEstoniaEthiopiaEuro areaEurope & Central AsiaEurope & Central Asia (excluding high income)Europe & Central Asia (IDA & IBRD countries)European UnionFaroe IslandsFijiFinlandFragile and conflict affected situationsFranceFrench PolynesiaGabonGambia, TheGeorgiaGermanyGhanaGibraltarGreeceGreenlandGrenadaGuatemalaGuineaGuyanaHaitiHeavily indebted poor countries (HIPC)High incomeHondurasHong Kong SAR, ChinaHungaryIBRD onlyIcelandIDA & IBRD totalIDA blendIDA onlyIDA totalIndiaIndonesiaIran, Islamic Rep.IraqIrelandIsraelItalyJamaicaJapanJordanKazakhstanKenyaKorea, Dem. People’s Rep.Korea, Rep.KuwaitLao PDRLate-demographic dividendLatin America & Caribbean Latin America & Caribbean (excluding high income)Latin America & the Caribbean (IDA & IBRD countries)LatviaLeast developed countries: UN classificationLebanonLiberiaLibyaLithuaniaLow & middle incomeLow incomeLower middle incomeLuxembourgMacao SAR, ChinaMacedonia, FYRMadagascarMalawiMalaysiaMaliMaltaMauritaniaMauritiusMexicoMiddle East & North AfricaMiddle East & North Africa (excluding high income)Middle East & North Africa (IDA & IBRD countries)Middle incomeMongoliaMontenegroMoroccoMozambiqueMyanmarNetherlandsNew CaledoniaNew ZealandNicaraguaNigerNigeriaNorth AmericaNorwayOECD membersOmanOther small statesPacific island small statesPakistanPanamaPapua New GuineaParaguayPeruPhilippinesPolandPortugalPost-demographic dividendPre-demographic dividendQatarRomaniaRussian FederationRwandaSamoaSaudi ArabiaSenegalSerbiaSierra LeoneSingaporeSlovak RepublicSloveniaSmall statesSomaliaSouth AfricaSouth AsiaSouth Asia (IDA & IBRD)SpainSri LankaSt. Kitts and NevisSt. LuciaSt. Vincent and the GrenadinesSub-Saharan Africa Sub-Saharan Africa (excluding high income)Sub-Saharan Africa (IDA & IBRD countries)SudanSurinameSwedenSwitzerlandSyrian Arab RepublicTanzaniaThailandTogoTrinidad and TobagoTunisiaTurkeyUgandaUkraineUnited Arab EmiratesUnited KingdomUnited StatesUpper middle incomeUruguayVenezuela, RBVietnamWorldYemen, Rep.ZambiaZimbabwe Linha do tempo:
Nesta escala de tempo está apresentado um gráfico de 1988 ano até 2015 ano St. Lucia. Dados de 1987 ano ausente. O número de observações reais por data: 28.
Fonte (nome):
Indicadores de desenvolvimento mundial
Fonte (organização):
World Bank staff estimates based data from International Monetary Fund's Direction of Trade database.
Categorias:
Private Sector, Trade
Foi atualizado:
23 abr 2017 ano
Indicadores de alterações dos valores ao longo dos anos
Mínimo:
4.369
1 jan 2007 ano
Máximo:
55.493
1 jan 2015 ano
Na data de observação
Valor
Mudança absoluta
A alteração em relação ao valor anterior
1 jan 1988 ano
13.26
+13.26
0.0%
1 jan 1989 ano
7.352
-5.908
-44.55%
1 jan 1990 ano
8.876
+1.524
20.73%
1 jan 1991 ano
7.36
-1.516
-17.08%
1 jan 1992 ano
7.027
-0.333
-4.52%
1 jan 1993 ano
5.757
-1.27
-18.08%
1 jan 1994 ano
11.564
+5.807
100.87%
1 jan 1995 ano
7.928
-3.636
-31.44%
1 jan 1996 ano
7.422
-0.506
-6.38%
1 jan 1997 ano
6.053
-1.369
-18.45%
1 jan 1998 ano
7.04
+0.987
16.31%
1 jan 1999 ano
7.196
+0.155
2.21%
1 jan 2000 ano
6.761
-0.435
-6.04%
1 jan 2001 ano
7.715
+0.954
14.11%
1 jan 2002 ano
6.074
-1.641
-21.27%
1 jan 2003 ano
8.797
+2.723
44.84%
1 jan 2004 ano
15.171
+6.373
72.45%
1 jan 2005 ano
23.267
+8.096
53.37%
1 jan 2006 ano
6.295
-16.972
-72.94%
1 jan 2007 ano
4.369
-1.926
-30.6%
1 jan 2008 ano
12.067
+7.698
176.19%
1 jan 2009 ano
15.594
+3.527
29.23%
1 jan 2010 ano
29.042
+13.447
86.23%
1 jan 2011 ano
38.242
+9.2
31.68%
1 jan 2012 ano
34.437
-3.805
-9.95%
1 jan 2013 ano
47.739
+13.303
38.63%
1 jan 2014 ano
54.383
+6.644
13.92%
1 jan 2015 ano
55.493
+1.11
2.04%
Classificação de países por estatísticas atuais por anos


Comentários: