29
/pt/
pt
AIzaSyAYiBZKx7MnpbEhh9jyipgxe19OcubqV5w
April 1, 2024
160733
Israel
ISR
true
2
1
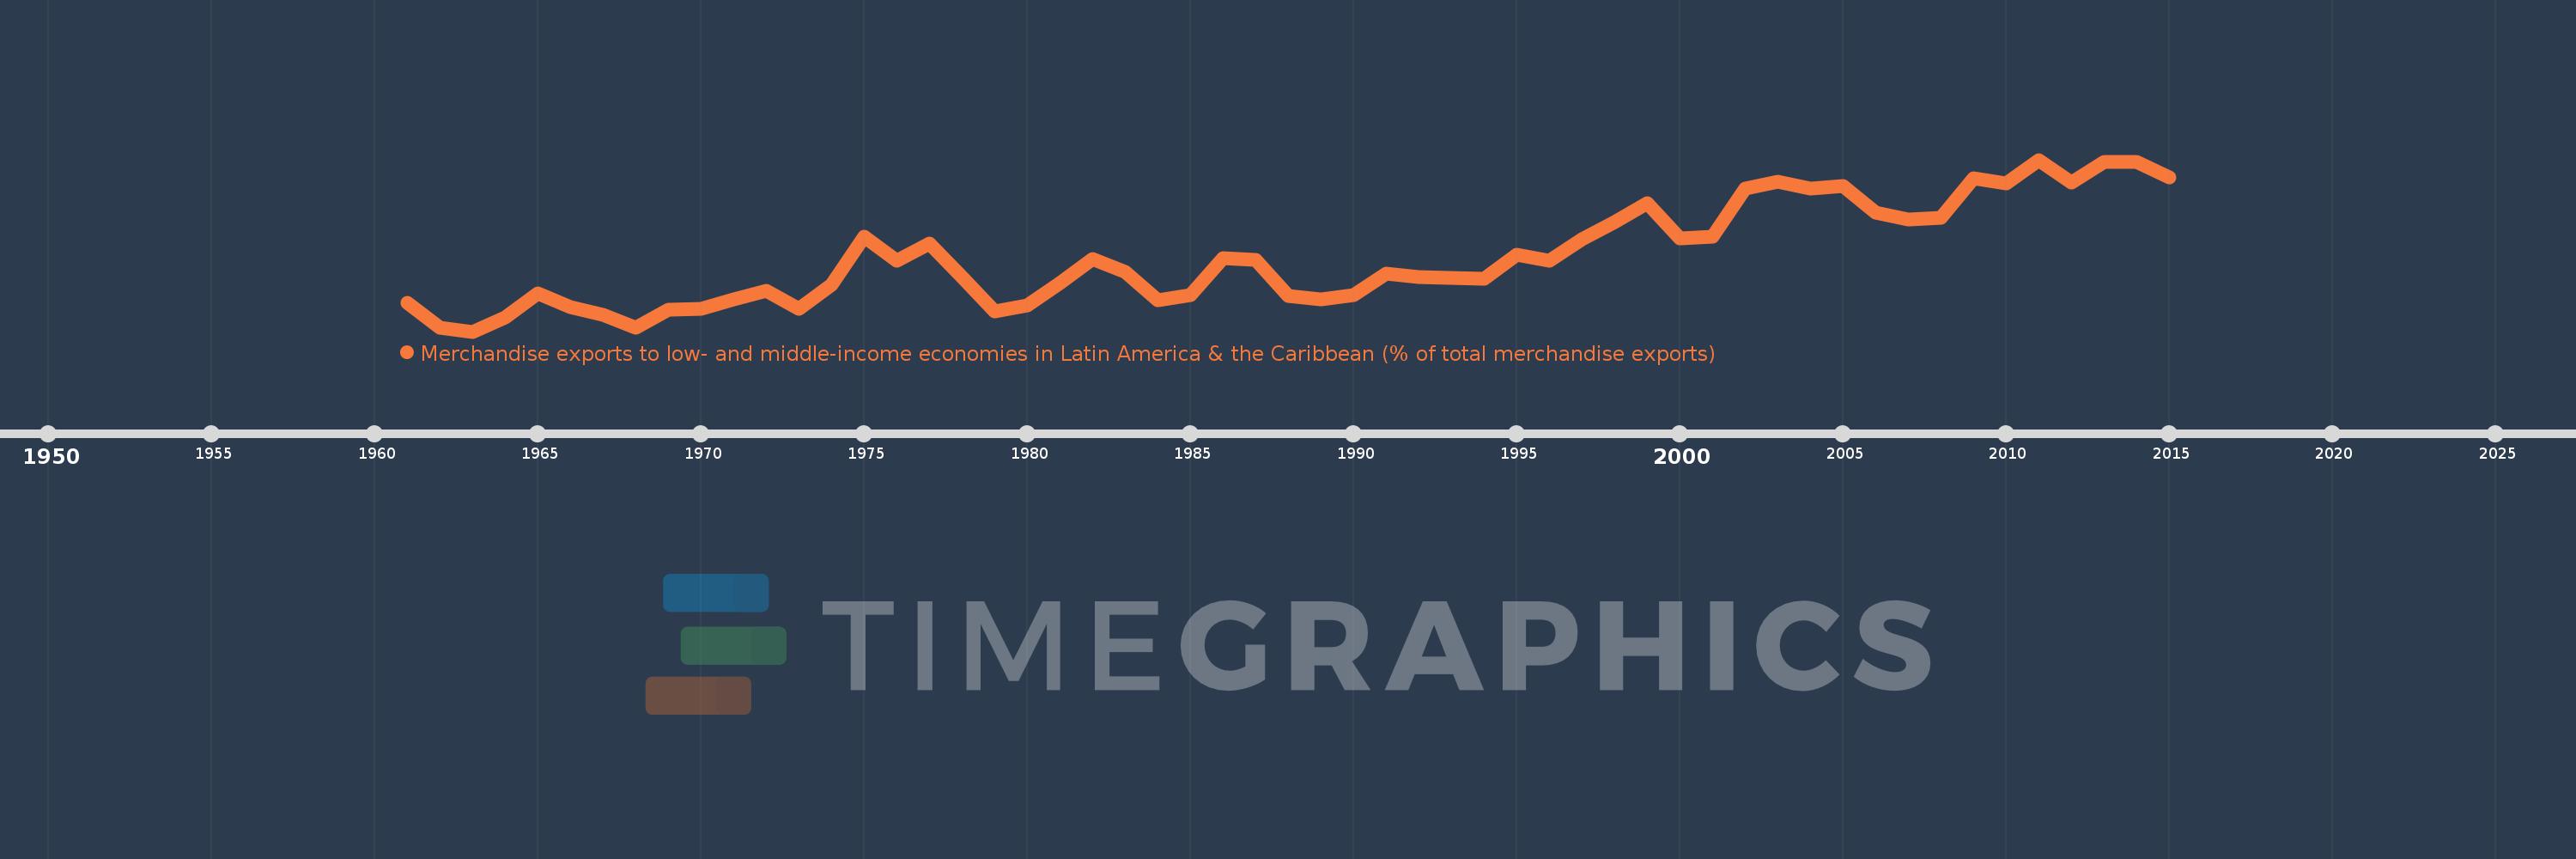
Merchandise exports to low- and middle-income economies in Latin America & the Caribbean (% of total merchandise exports)
2015,2014,2013,2012,2011,2010,2009,2008,2007,2006,2005,2004,2003,2002,2001,2000,1999,1998,1997,1996,1995,1994,1993,1992,1991,1990,1989,1988,1987,1986,1985,1984,1983,1982,1981,1980,1979,1978,1977,1976,1975,1974,1973,1972,1971,1970,1969,1968,1967,1966,1965,1964,1963,1962,1961
Estas estatísticas em outros países:
AfghanistanAlbaniaAlgeriaAngolaAntigua and BarbudaArab WorldArgentinaArmeniaArubaAustraliaAustriaAzerbaijanBahamas, TheBahrainBangladeshBarbadosBelarusBelgiumBelizeBeninBermudaBoliviaBrazilBrunei DarussalamBulgariaBurundiCabo VerdeCambodiaCameroonCanadaCaribbean small statesCentral African RepublicCentral Europe and the BalticsChileChinaColombiaCongo, Dem. Rep.Congo, Rep.Costa RicaCote d'IvoireCroatiaCubaCyprusCzech RepublicDenmarkDominicaDominican RepublicEarly-demographic dividendEast Asia & PacificEast Asia & Pacific (excluding high income)East Asia & Pacific (IDA & IBRD countries)EcuadorEgypt, Arab Rep.El SalvadorEstoniaEthiopiaEuro areaEurope & Central AsiaEurope & Central Asia (excluding high income)Europe & Central Asia (IDA & IBRD countries)European UnionFaroe IslandsFijiFinlandFragile and conflict affected situationsFranceFrench PolynesiaGabonGambia, TheGeorgiaGermanyGhanaGibraltarGreeceGreenlandGrenadaGuatemalaGuineaGuyanaHaitiHeavily indebted poor countries (HIPC)High incomeHondurasHong Kong SAR, ChinaHungaryIBRD onlyIcelandIDA & IBRD totalIDA blendIDA onlyIDA totalIndiaIndonesiaIran, Islamic Rep.IraqIrelandIsraelItalyJamaicaJapanJordanKazakhstanKenyaKorea, Dem. People’s Rep.Korea, Rep.KuwaitLao PDRLate-demographic dividendLatin America & Caribbean Latin America & Caribbean (excluding high income)Latin America & the Caribbean (IDA & IBRD countries)LatviaLeast developed countries: UN classificationLebanonLiberiaLibyaLithuaniaLow & middle incomeLow incomeLower middle incomeLuxembourgMacao SAR, ChinaMacedonia, FYRMadagascarMalawiMalaysiaMaliMaltaMauritaniaMauritiusMexicoMiddle East & North AfricaMiddle East & North Africa (excluding high income)Middle East & North Africa (IDA & IBRD countries)Middle incomeMongoliaMontenegroMoroccoMozambiqueMyanmarNetherlandsNew CaledoniaNew ZealandNicaraguaNigerNigeriaNorth AmericaNorwayOECD membersOmanOther small statesPacific island small statesPakistanPanamaPapua New GuineaParaguayPeruPhilippinesPolandPortugalPost-demographic dividendPre-demographic dividendQatarRomaniaRussian FederationRwandaSamoaSaudi ArabiaSenegalSerbiaSierra LeoneSingaporeSlovak RepublicSloveniaSmall statesSomaliaSouth AfricaSouth AsiaSouth Asia (IDA & IBRD)SpainSri LankaSt. Kitts and NevisSt. LuciaSt. Vincent and the GrenadinesSub-Saharan Africa Sub-Saharan Africa (excluding high income)Sub-Saharan Africa (IDA & IBRD countries)SudanSurinameSwedenSwitzerlandSyrian Arab RepublicTanzaniaThailandTogoTrinidad and TobagoTunisiaTurkeyUgandaUkraineUnited Arab EmiratesUnited KingdomUnited StatesUpper middle incomeUruguayVenezuela, RBVietnamWorldYemen, Rep.ZambiaZimbabwe Linha do tempo:
Nesta escala de tempo está apresentado um gráfico de 1961 ano até 2015 ano Israel. Dados de 1960 ano ausente. O número de observações reais por data: 55.
Fonte (nome):
Indicadores de desenvolvimento mundial
Fonte (organização):
World Bank staff estimates based data from International Monetary Fund's Direction of Trade database.
Categorias:
Private Sector, Trade
Foi atualizado:
23 abr 2017 ano
Indicadores de alterações dos valores ao longo dos anos
Mínimo:
0.468
1 jan 1963 ano
Máximo:
3.508
1 jan 2011 ano
Na data de observação
Valor
Mudança absoluta
A alteração em relação ao valor anterior
1 jan 1961 ano
0.979
+0.979
0.0%
1 jan 1962 ano
0.531
-0.447
-45.71%
1 jan 1963 ano
0.468
-0.063
-11.92%
1 jan 1964 ano
0.717
+0.249
53.12%
1 jan 1965 ano
1.144
+0.428
59.67%
1 jan 1966 ano
0.894
-0.25
-21.87%
1 jan 1967 ano
0.76
-0.134
-15.03%
1 jan 1968 ano
0.542
-0.217
-28.63%
1 jan 1969 ano
0.859
+0.317
58.53%
1 jan 1970 ano
0.874
+0.014
1.65%
1 jan 1971 ano
1.039
+0.165
18.93%
1 jan 1972 ano
1.193
+0.154
14.87%
1 jan 1973 ano
0.873
-0.321
-26.86%
1 jan 1974 ano
1.294
+0.421
48.26%
1 jan 1975 ano
2.148
+0.854
66.01%
1 jan 1976 ano
1.719
-0.429
-19.96%
1 jan 1977 ano
2.02
+0.301
17.49%
1 jan 1978 ano
1.426
-0.594
-29.39%
1 jan 1979 ano
0.823
-0.604
-42.31%
1 jan 1980 ano
0.933
+0.111
13.45%
1 jan 1981 ano
1.328
+0.394
42.24%
1 jan 1982 ano
1.749
+0.421
31.69%
1 jan 1983 ano
1.523
-0.226
-12.92%
1 jan 1984 ano
1.028
-0.495
-32.5%
1 jan 1985 ano
1.114
+0.086
8.37%
1 jan 1986 ano
1.772
+0.658
59.06%
1 jan 1987 ano
1.739
-0.033
-1.85%
1 jan 1988 ano
1.1
-0.639
-36.73%
1 jan 1989 ano
1.043
-0.058
-5.24%
1 jan 1990 ano
1.112
+0.07
6.7%
1 jan 1991 ano
1.496
+0.384
34.49%
1 jan 1992 ano
1.427
-0.069
-4.64%
1 jan 1993 ano
1.425
-0.002
-0.13%
1 jan 1994 ano
1.41
-0.015
-1.05%
1 jan 1995 ano
1.836
+0.426
30.21%
1 jan 1996 ano
1.725
-0.11
-6.01%
1 jan 1997 ano
2.109
+0.384
22.24%
1 jan 1998 ano
2.411
+0.302
14.31%
1 jan 1999 ano
2.746
+0.335
13.89%
1 jan 2000 ano
2.112
-0.634
-23.08%
1 jan 2001 ano
2.153
+0.041
1.95%
1 jan 2002 ano
2.995
+0.842
39.09%
1 jan 2003 ano
3.126
+0.131
4.37%
1 jan 2004 ano
2.997
-0.129
-4.13%
1 jan 2005 ano
3.041
+0.044
1.48%
1 jan 2006 ano
2.569
-0.473
-15.54%
1 jan 2007 ano
2.447
-0.122
-4.74%
1 jan 2008 ano
2.488
+0.041
1.69%
1 jan 2009 ano
3.185
+0.697
28.03%
1 jan 2010 ano
3.087
-0.099
-3.1%
1 jan 2011 ano
3.508
+0.422
13.66%
1 jan 2012 ano
3.108
-0.4
-11.4%
1 jan 2013 ano
3.471
+0.363
11.68%
1 jan 2014 ano
3.467
-0.004
-0.12%
1 jan 2015 ano
3.194
-0.273
-7.88%
Classificação de países por estatísticas atuais por anos


Comentários: