29
/pt/
pt
AIzaSyAYiBZKx7MnpbEhh9jyipgxe19OcubqV5w
April 1, 2024
247806
Spain
ESP
true
2
1
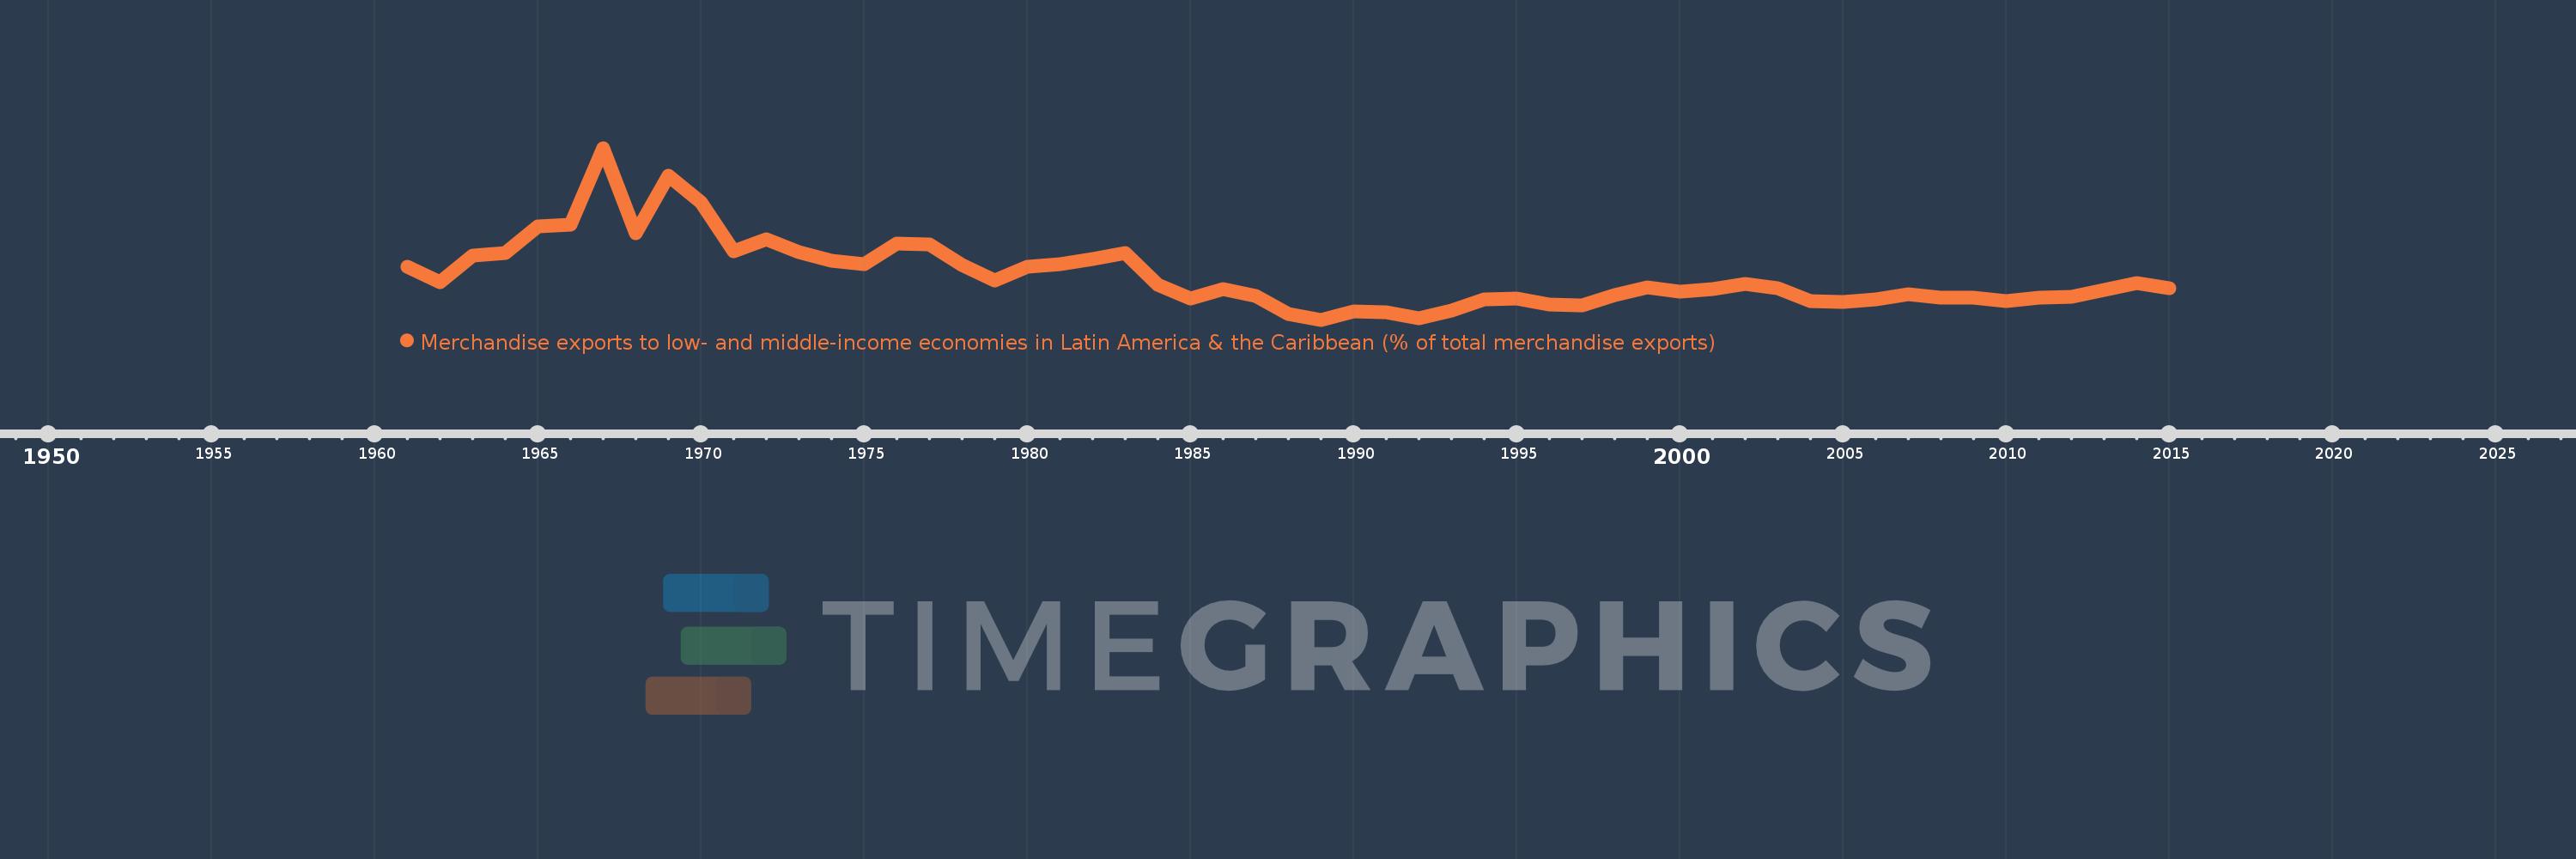
Merchandise exports to low- and middle-income economies in Latin America & the Caribbean (% of total merchandise exports)
2015,2014,2013,2012,2011,2010,2009,2008,2007,2006,2005,2004,2003,2002,2001,2000,1999,1998,1997,1996,1995,1994,1993,1992,1991,1990,1989,1988,1987,1986,1985,1984,1983,1982,1981,1980,1979,1978,1977,1976,1975,1974,1973,1972,1971,1970,1969,1968,1967,1966,1965,1964,1963,1962,1961
Estas estatísticas em outros países:
AfghanistanAlbaniaAlgeriaAngolaAntigua and BarbudaArab WorldArgentinaArmeniaArubaAustraliaAustriaAzerbaijanBahamas, TheBahrainBangladeshBarbadosBelarusBelgiumBelizeBeninBermudaBoliviaBrazilBrunei DarussalamBulgariaBurundiCabo VerdeCambodiaCameroonCanadaCaribbean small statesCentral African RepublicCentral Europe and the BalticsChileChinaColombiaCongo, Dem. Rep.Congo, Rep.Costa RicaCote d'IvoireCroatiaCubaCyprusCzech RepublicDenmarkDominicaDominican RepublicEarly-demographic dividendEast Asia & PacificEast Asia & Pacific (excluding high income)East Asia & Pacific (IDA & IBRD countries)EcuadorEgypt, Arab Rep.El SalvadorEstoniaEthiopiaEuro areaEurope & Central AsiaEurope & Central Asia (excluding high income)Europe & Central Asia (IDA & IBRD countries)European UnionFaroe IslandsFijiFinlandFragile and conflict affected situationsFranceFrench PolynesiaGabonGambia, TheGeorgiaGermanyGhanaGibraltarGreeceGreenlandGrenadaGuatemalaGuineaGuyanaHaitiHeavily indebted poor countries (HIPC)High incomeHondurasHong Kong SAR, ChinaHungaryIBRD onlyIcelandIDA & IBRD totalIDA blendIDA onlyIDA totalIndiaIndonesiaIran, Islamic Rep.IraqIrelandIsraelItalyJamaicaJapanJordanKazakhstanKenyaKorea, Dem. People’s Rep.Korea, Rep.KuwaitLao PDRLate-demographic dividendLatin America & Caribbean Latin America & Caribbean (excluding high income)Latin America & the Caribbean (IDA & IBRD countries)LatviaLeast developed countries: UN classificationLebanonLiberiaLibyaLithuaniaLow & middle incomeLow incomeLower middle incomeLuxembourgMacao SAR, ChinaMacedonia, FYRMadagascarMalawiMalaysiaMaliMaltaMauritaniaMauritiusMexicoMiddle East & North AfricaMiddle East & North Africa (excluding high income)Middle East & North Africa (IDA & IBRD countries)Middle incomeMongoliaMontenegroMoroccoMozambiqueMyanmarNetherlandsNew CaledoniaNew ZealandNicaraguaNigerNigeriaNorth AmericaNorwayOECD membersOmanOther small statesPacific island small statesPakistanPanamaPapua New GuineaParaguayPeruPhilippinesPolandPortugalPost-demographic dividendPre-demographic dividendQatarRomaniaRussian FederationRwandaSamoaSaudi ArabiaSenegalSerbiaSierra LeoneSingaporeSlovak RepublicSloveniaSmall statesSomaliaSouth AfricaSouth AsiaSouth Asia (IDA & IBRD)SpainSri LankaSt. Kitts and NevisSt. LuciaSt. Vincent and the GrenadinesSub-Saharan Africa Sub-Saharan Africa (excluding high income)Sub-Saharan Africa (IDA & IBRD countries)SudanSurinameSwedenSwitzerlandSyrian Arab RepublicTanzaniaThailandTogoTrinidad and TobagoTunisiaTurkeyUgandaUkraineUnited Arab EmiratesUnited KingdomUnited StatesUpper middle incomeUruguayVenezuela, RBVietnamWorldYemen, Rep.ZambiaZimbabwe Linha do tempo:
Nesta escala de tempo está apresentado um gráfico de 1961 ano até 2015 ano Spain. Dados de 1960 ano ausente. O número de observações reais por data: 55.
Fonte (nome):
Indicadores de desenvolvimento mundial
Fonte (organização):
World Bank staff estimates based data from International Monetary Fund's Direction of Trade database.
Categorias:
Private Sector, Trade
Foi atualizado:
23 abr 2017 ano
Indicadores de alterações dos valores ao longo dos anos
Mínimo:
2.334
1 jan 1989 ano
Máximo:
12.982
1 jan 1967 ano
Na data de observação
Valor
Mudança absoluta
A alteração em relação ao valor anterior
1 jan 1961 ano
5.601
+5.601
0.0%
1 jan 1962 ano
4.642
-0.959
-17.12%
1 jan 1963 ano
6.295
+1.653
35.61%
1 jan 1964 ano
6.454
+0.159
2.52%
1 jan 1965 ano
8.1
+1.646
25.51%
1 jan 1966 ano
8.223
+0.123
1.52%
1 jan 1967 ano
12.982
+4.759
57.88%
1 jan 1968 ano
7.713
-5.269
-40.59%
1 jan 1969 ano
11.245
+3.532
45.79%
1 jan 1970 ano
9.594
-1.651
-14.68%
1 jan 1971 ano
6.597
-2.996
-31.23%
1 jan 1972 ano
7.329
+0.731
11.09%
1 jan 1973 ano
6.541
-0.787
-10.74%
1 jan 1974 ano
5.971
-0.57
-8.72%
1 jan 1975 ano
5.795
-0.177
-2.96%
1 jan 1976 ano
7.063
+1.269
21.89%
1 jan 1977 ano
6.993
-0.07
-0.99%
1 jan 1978 ano
5.75
-1.244
-17.78%
1 jan 1979 ano
4.76
-0.99
-17.22%
1 jan 1980 ano
5.609
+0.849
17.84%
1 jan 1981 ano
5.766
+0.157
2.8%
1 jan 1982 ano
6.072
+0.306
5.3%
1 jan 1983 ano
6.476
+0.405
6.67%
1 jan 1984 ano
4.519
-1.958
-30.23%
1 jan 1985 ano
3.647
-0.872
-19.3%
1 jan 1986 ano
4.239
+0.593
16.25%
1 jan 1987 ano
3.834
-0.406
-9.57%
1 jan 1988 ano
2.69
-1.143
-29.83%
1 jan 1989 ano
2.334
-0.356
-13.24%
1 jan 1990 ano
2.855
+0.521
22.31%
1 jan 1991 ano
2.794
-0.061
-2.14%
1 jan 1992 ano
2.451
-0.342
-12.25%
1 jan 1993 ano
2.884
+0.432
17.64%
1 jan 1994 ano
3.589
+0.706
24.47%
1 jan 1995 ano
3.644
+0.055
1.53%
1 jan 1996 ano
3.281
-0.364
-9.98%
1 jan 1997 ano
3.213
-0.068
-2.08%
1 jan 1998 ano
3.837
+0.624
19.43%
1 jan 1999 ano
4.327
+0.491
12.79%
1 jan 2000 ano
4.079
-0.249
-5.75%
1 jan 2001 ano
4.216
+0.137
3.36%
1 jan 2002 ano
4.537
+0.321
7.62%
1 jan 2003 ano
4.263
-0.274
-6.04%
1 jan 2004 ano
3.511
-0.752
-17.64%
1 jan 2005 ano
3.442
-0.069
-1.97%
1 jan 2006 ano
3.577
+0.136
3.94%
1 jan 2007 ano
3.895
+0.317
8.86%
1 jan 2008 ano
3.711
-0.184
-4.72%
1 jan 2009 ano
3.686
-0.025
-0.67%
1 jan 2010 ano
3.485
-0.201
-5.46%
1 jan 2011 ano
3.695
+0.21
6.03%
1 jan 2012 ano
3.748
+0.053
1.42%
1 jan 2013 ano
4.19
+0.443
11.81%
1 jan 2014 ano
4.618
+0.427
10.2%
1 jan 2015 ano
4.304
-0.314
-6.8%
Classificação de países por estatísticas atuais por anos


Comentários: