29
/pt/
pt
AIzaSyAYiBZKx7MnpbEhh9jyipgxe19OcubqV5w
April 1, 2024
171944
Kuwait
KWT
true
2
1
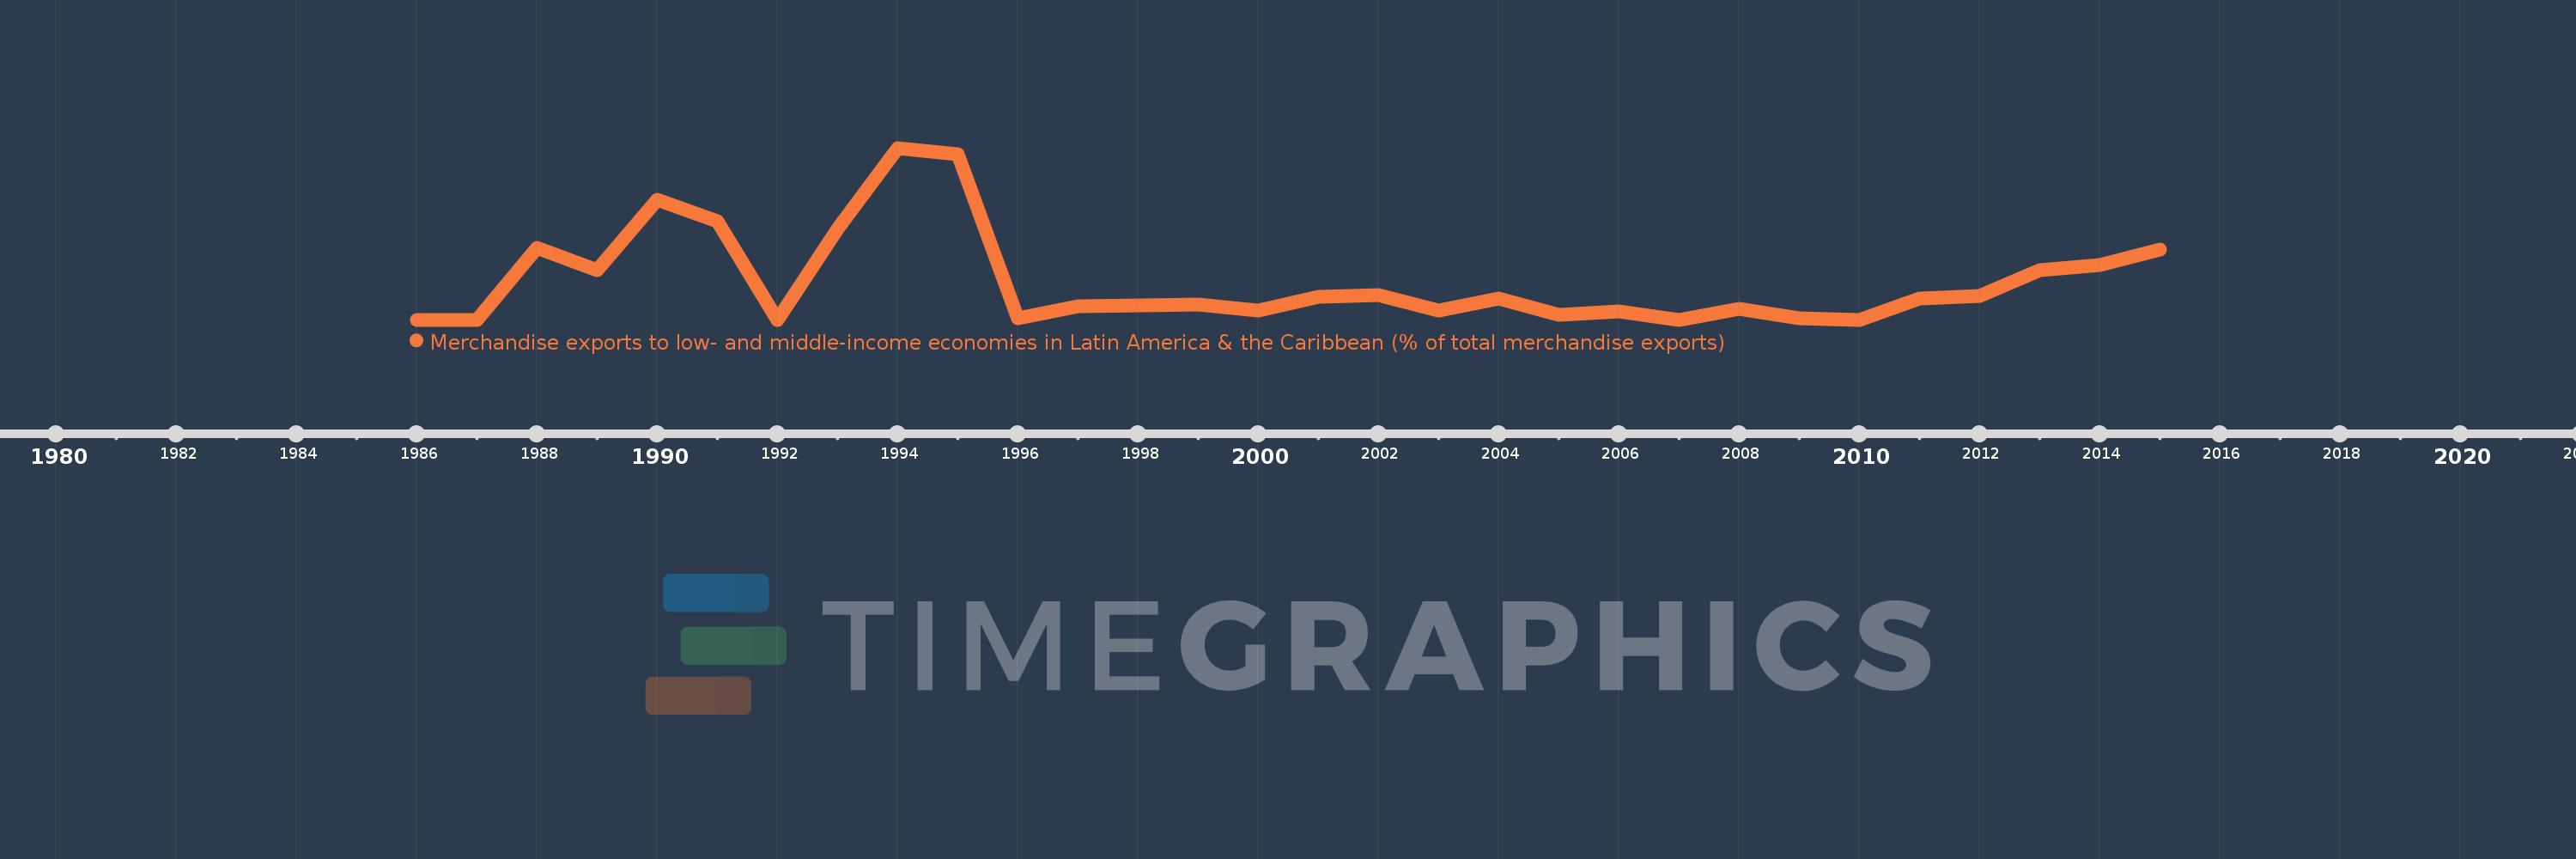
Merchandise exports to low- and middle-income economies in Latin America & the Caribbean (% of total merchandise exports)
2015,2014,2013,2012,2011,2010,2009,2008,2007,2006,2005,2004,2003,2002,2001,2000,1999,1998,1997,1996,1995,1994,1993,1992,1991,1990,1989,1988,1987,1986
Estas estatísticas em outros países:
AfghanistanAlbaniaAlgeriaAngolaAntigua and BarbudaArab WorldArgentinaArmeniaArubaAustraliaAustriaAzerbaijanBahamas, TheBahrainBangladeshBarbadosBelarusBelgiumBelizeBeninBermudaBoliviaBrazilBrunei DarussalamBulgariaBurundiCabo VerdeCambodiaCameroonCanadaCaribbean small statesCentral African RepublicCentral Europe and the BalticsChileChinaColombiaCongo, Dem. Rep.Congo, Rep.Costa RicaCote d'IvoireCroatiaCubaCyprusCzech RepublicDenmarkDominicaDominican RepublicEarly-demographic dividendEast Asia & PacificEast Asia & Pacific (excluding high income)East Asia & Pacific (IDA & IBRD countries)EcuadorEgypt, Arab Rep.El SalvadorEstoniaEthiopiaEuro areaEurope & Central AsiaEurope & Central Asia (excluding high income)Europe & Central Asia (IDA & IBRD countries)European UnionFaroe IslandsFijiFinlandFragile and conflict affected situationsFranceFrench PolynesiaGabonGambia, TheGeorgiaGermanyGhanaGibraltarGreeceGreenlandGrenadaGuatemalaGuineaGuyanaHaitiHeavily indebted poor countries (HIPC)High incomeHondurasHong Kong SAR, ChinaHungaryIBRD onlyIcelandIDA & IBRD totalIDA blendIDA onlyIDA totalIndiaIndonesiaIran, Islamic Rep.IraqIrelandIsraelItalyJamaicaJapanJordanKazakhstanKenyaKorea, Dem. People’s Rep.Korea, Rep.KuwaitLao PDRLate-demographic dividendLatin America & Caribbean Latin America & Caribbean (excluding high income)Latin America & the Caribbean (IDA & IBRD countries)LatviaLeast developed countries: UN classificationLebanonLiberiaLibyaLithuaniaLow & middle incomeLow incomeLower middle incomeLuxembourgMacao SAR, ChinaMacedonia, FYRMadagascarMalawiMalaysiaMaliMaltaMauritaniaMauritiusMexicoMiddle East & North AfricaMiddle East & North Africa (excluding high income)Middle East & North Africa (IDA & IBRD countries)Middle incomeMongoliaMontenegroMoroccoMozambiqueMyanmarNetherlandsNew CaledoniaNew ZealandNicaraguaNigerNigeriaNorth AmericaNorwayOECD membersOmanOther small statesPacific island small statesPakistanPanamaPapua New GuineaParaguayPeruPhilippinesPolandPortugalPost-demographic dividendPre-demographic dividendQatarRomaniaRussian FederationRwandaSamoaSaudi ArabiaSenegalSerbiaSierra LeoneSingaporeSlovak RepublicSloveniaSmall statesSomaliaSouth AfricaSouth AsiaSouth Asia (IDA & IBRD)SpainSri LankaSt. Kitts and NevisSt. LuciaSt. Vincent and the GrenadinesSub-Saharan Africa Sub-Saharan Africa (excluding high income)Sub-Saharan Africa (IDA & IBRD countries)SudanSurinameSwedenSwitzerlandSyrian Arab RepublicTanzaniaThailandTogoTrinidad and TobagoTunisiaTurkeyUgandaUkraineUnited Arab EmiratesUnited KingdomUnited StatesUpper middle incomeUruguayVenezuela, RBVietnamWorldYemen, Rep.ZambiaZimbabwe Linha do tempo:
Nesta escala de tempo está apresentado um gráfico de 1986 ano até 2015 ano Kuwait. Dados de 1985 ano ausente. O número de observações reais por data: 30.
Fonte (nome):
Indicadores de desenvolvimento mundial
Fonte (organização):
World Bank staff estimates based data from International Monetary Fund's Direction of Trade database.
Categorias:
Private Sector, Trade
Foi atualizado:
23 abr 2017 ano
Indicadores de alterações dos valores ao longo dos anos
Máximo:
3.252
1 jan 1994 ano
Na data de observação
Valor
Mudança absoluta
A alteração em relação ao valor anterior
1 jan 1986 ano
0.0
+0.0
0.0%
1 jan 1987 ano
0.001
+0.001
302.03%
1 jan 1988 ano
1.353
+1.351
101.57 mil%
1 jan 1989 ano
0.937
-0.416
-30.76%
1 jan 1990 ano
2.27
+1.333
142.35%
1 jan 1991 ano
1.859
-0.411
-18.1%
1 jan 1992 ano
0.0
-1.859
-100.0%
1 jan 1993 ano
1.721
+1.721
%
1 jan 1994 ano
3.252
+1.531
88.97%
1 jan 1995 ano
3.13
-0.122
-3.77%
1 jan 1996 ano
0.024
-3.106
-99.23%
1 jan 1997 ano
0.248
+0.224
923.46%
1 jan 1998 ano
0.273
+0.025
10.05%
1 jan 1999 ano
0.287
+0.014
5.13%
1 jan 2000 ano
0.172
-0.115
-40.01%
1 jan 2001 ano
0.438
+0.266
154.53%
1 jan 2002 ano
0.465
+0.027
6.2%
1 jan 2003 ano
0.182
-0.283
-60.93%
1 jan 2004 ano
0.396
+0.214
117.97%
1 jan 2005 ano
0.09
-0.305
-77.15%
1 jan 2006 ano
0.155
+0.064
71.25%
1 jan 2007 ano
0.003
-0.152
-98.33%
1 jan 2008 ano
0.21
+0.207
8.03 mil%
1 jan 2009 ano
0.035
-0.175
-83.43%
1 jan 2010 ano
0.003
-0.032
-91.26%
1 jan 2011 ano
0.4
+0.397
13.07 mil%
1 jan 2012 ano
0.452
+0.052
12.98%
1 jan 2013 ano
0.931
+0.478
105.68%
1 jan 2014 ano
1.039
+0.108
11.65%
1 jan 2015 ano
1.324
+0.285
27.47%
Classificação de países por estatísticas atuais por anos


Comentários: