29
/pt/
pt
AIzaSyAYiBZKx7MnpbEhh9jyipgxe19OcubqV5w
April 1, 2024
257555
Switzerland
CHE
true
2
1
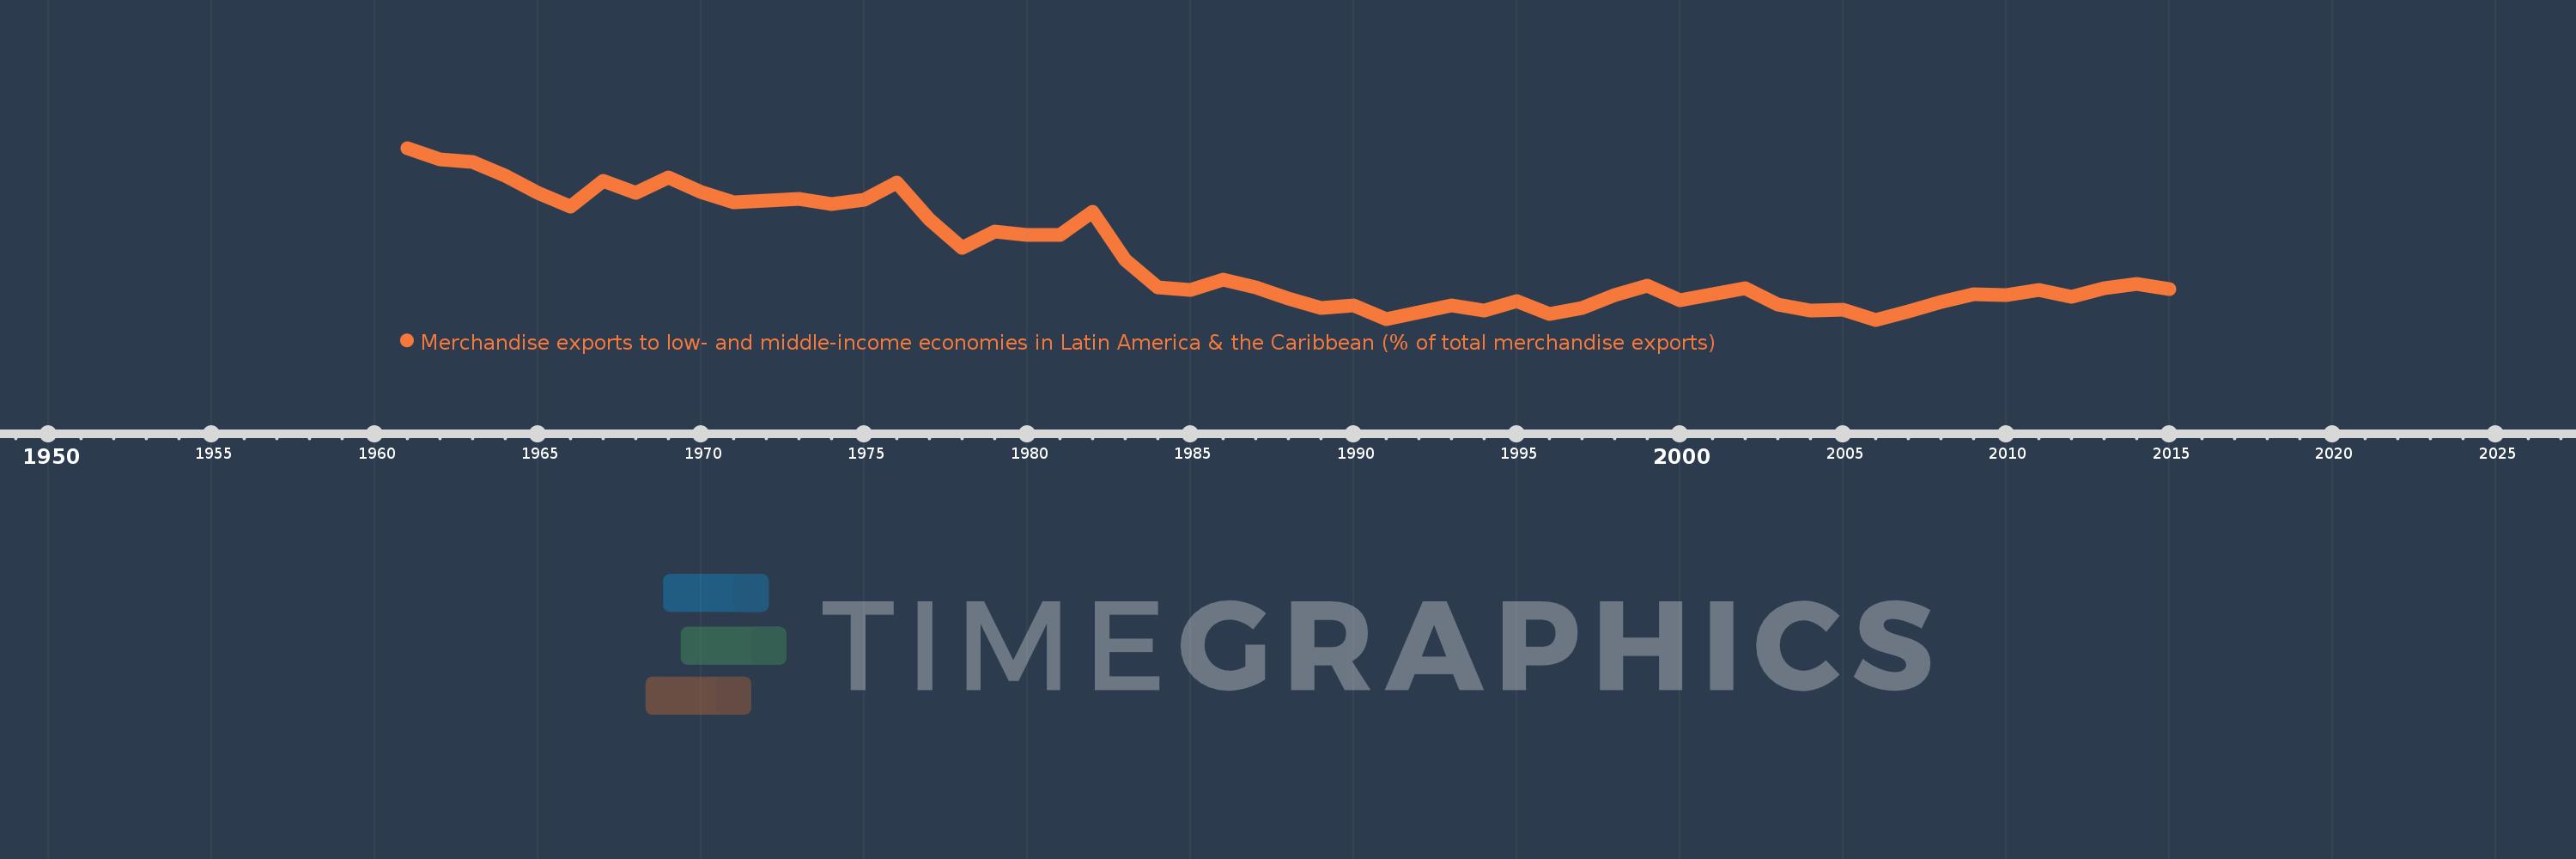
Merchandise exports to low- and middle-income economies in Latin America & the Caribbean (% of total merchandise exports)
2015,2014,2013,2012,2011,2010,2009,2008,2007,2006,2005,2004,2003,2002,2001,2000,1999,1998,1997,1996,1995,1994,1993,1992,1991,1990,1989,1988,1987,1986,1985,1984,1983,1982,1981,1980,1979,1978,1977,1976,1975,1974,1973,1972,1971,1970,1969,1968,1967,1966,1965,1964,1963,1962,1961
Estas estatísticas em outros países:
AfghanistanAlbaniaAlgeriaAngolaAntigua and BarbudaArab WorldArgentinaArmeniaArubaAustraliaAustriaAzerbaijanBahamas, TheBahrainBangladeshBarbadosBelarusBelgiumBelizeBeninBermudaBoliviaBrazilBrunei DarussalamBulgariaBurundiCabo VerdeCambodiaCameroonCanadaCaribbean small statesCentral African RepublicCentral Europe and the BalticsChileChinaColombiaCongo, Dem. Rep.Congo, Rep.Costa RicaCote d'IvoireCroatiaCubaCyprusCzech RepublicDenmarkDominicaDominican RepublicEarly-demographic dividendEast Asia & PacificEast Asia & Pacific (excluding high income)East Asia & Pacific (IDA & IBRD countries)EcuadorEgypt, Arab Rep.El SalvadorEstoniaEthiopiaEuro areaEurope & Central AsiaEurope & Central Asia (excluding high income)Europe & Central Asia (IDA & IBRD countries)European UnionFaroe IslandsFijiFinlandFragile and conflict affected situationsFranceFrench PolynesiaGabonGambia, TheGeorgiaGermanyGhanaGibraltarGreeceGreenlandGrenadaGuatemalaGuineaGuyanaHaitiHeavily indebted poor countries (HIPC)High incomeHondurasHong Kong SAR, ChinaHungaryIBRD onlyIcelandIDA & IBRD totalIDA blendIDA onlyIDA totalIndiaIndonesiaIran, Islamic Rep.IraqIrelandIsraelItalyJamaicaJapanJordanKazakhstanKenyaKorea, Dem. People’s Rep.Korea, Rep.KuwaitLao PDRLate-demographic dividendLatin America & Caribbean Latin America & Caribbean (excluding high income)Latin America & the Caribbean (IDA & IBRD countries)LatviaLeast developed countries: UN classificationLebanonLiberiaLibyaLithuaniaLow & middle incomeLow incomeLower middle incomeLuxembourgMacao SAR, ChinaMacedonia, FYRMadagascarMalawiMalaysiaMaliMaltaMauritaniaMauritiusMexicoMiddle East & North AfricaMiddle East & North Africa (excluding high income)Middle East & North Africa (IDA & IBRD countries)Middle incomeMongoliaMontenegroMoroccoMozambiqueMyanmarNetherlandsNew CaledoniaNew ZealandNicaraguaNigerNigeriaNorth AmericaNorwayOECD membersOmanOther small statesPacific island small statesPakistanPanamaPapua New GuineaParaguayPeruPhilippinesPolandPortugalPost-demographic dividendPre-demographic dividendQatarRomaniaRussian FederationRwandaSamoaSaudi ArabiaSenegalSerbiaSierra LeoneSingaporeSlovak RepublicSloveniaSmall statesSomaliaSouth AfricaSouth AsiaSouth Asia (IDA & IBRD)SpainSri LankaSt. Kitts and NevisSt. LuciaSt. Vincent and the GrenadinesSub-Saharan Africa Sub-Saharan Africa (excluding high income)Sub-Saharan Africa (IDA & IBRD countries)SudanSurinameSwedenSwitzerlandSyrian Arab RepublicTanzaniaThailandTogoTrinidad and TobagoTunisiaTurkeyUgandaUkraineUnited Arab EmiratesUnited KingdomUnited StatesUpper middle incomeUruguayVenezuela, RBVietnamWorldYemen, Rep.ZambiaZimbabwe Linha do tempo:
Nesta escala de tempo está apresentado um gráfico de 1961 ano até 2015 ano Switzerland. Dados de 1960 ano ausente. O número de observações reais por data: 55.
Fonte (nome):
Indicadores de desenvolvimento mundial
Fonte (organização):
World Bank staff estimates based data from International Monetary Fund's Direction of Trade database.
Categorias:
Private Sector, Trade
Foi atualizado:
23 abr 2017 ano
Indicadores de alterações dos valores ao longo dos anos
Máximo:
4.657
1 jan 1961 ano
Na data de observação
Valor
Mudança absoluta
A alteração em relação ao valor anterior
1 jan 1961 ano
4.657
+4.657
0.0%
1 jan 1962 ano
4.471
-0.186
-3.99%
1 jan 1963 ano
4.431
-0.04
-0.88%
1 jan 1964 ano
4.2
-0.231
-5.22%
1 jan 1965 ano
3.907
-0.293
-6.98%
1 jan 1966 ano
3.684
-0.223
-5.71%
1 jan 1967 ano
4.107
+0.423
11.49%
1 jan 1968 ano
3.906
-0.202
-4.91%
1 jan 1969 ano
4.164
+0.258
6.61%
1 jan 1970 ano
3.919
-0.244
-5.87%
1 jan 1971 ano
3.754
-0.165
-4.21%
1 jan 1972 ano
3.786
+0.032
0.85%
1 jan 1973 ano
3.809
+0.023
0.6%
1 jan 1974 ano
3.724
-0.085
-2.24%
1 jan 1975 ano
3.795
+0.071
1.9%
1 jan 1976 ano
4.079
+0.285
7.5%
1 jan 1977 ano
3.473
-0.607
-14.88%
1 jan 1978 ano
2.999
-0.473
-13.63%
1 jan 1979 ano
3.272
+0.273
9.1%
1 jan 1980 ano
3.207
-0.066
-2.01%
1 jan 1981 ano
3.213
+0.006
0.19%
1 jan 1982 ano
3.601
+0.388
12.09%
1 jan 1983 ano
2.79
-0.811
-22.51%
1 jan 1984 ano
2.337
-0.453
-16.24%
1 jan 1985 ano
2.291
-0.046
-1.96%
1 jan 1986 ano
2.469
+0.178
7.77%
1 jan 1987 ano
2.34
-0.129
-5.22%
1 jan 1988 ano
2.146
-0.194
-8.3%
1 jan 1989 ano
1.998
-0.148
-6.89%
1 jan 1990 ano
2.043
+0.044
2.22%
1 jan 1991 ano
1.806
-0.237
-11.58%
1 jan 1992 ano
1.925
+0.119
6.6%
1 jan 1993 ano
2.035
+0.109
5.68%
1 jan 1994 ano
1.952
-0.083
-4.06%
1 jan 1995 ano
2.107
+0.155
7.95%
1 jan 1996 ano
1.889
-0.218
-10.35%
1 jan 1997 ano
2.0
+0.11
5.84%
1 jan 1998 ano
2.214
+0.214
10.72%
1 jan 1999 ano
2.366
+0.153
6.89%
1 jan 2000 ano
2.126
-0.24
-10.15%
1 jan 2001 ano
2.23
+0.104
4.87%
1 jan 2002 ano
2.32
+0.09
4.02%
1 jan 2003 ano
2.054
-0.266
-11.47%
1 jan 2004 ano
1.957
-0.097
-4.7%
1 jan 2005 ano
1.973
+0.016
0.8%
1 jan 2006 ano
1.8
-0.172
-8.73%
1 jan 2007 ano
1.945
+0.145
8.03%
1 jan 2008 ano
2.094
+0.149
7.66%
1 jan 2009 ano
2.228
+0.134
6.42%
1 jan 2010 ano
2.212
-0.016
-0.72%
1 jan 2011 ano
2.293
+0.081
3.67%
1 jan 2012 ano
2.185
-0.108
-4.72%
1 jan 2013 ano
2.319
+0.134
6.14%
1 jan 2014 ano
2.399
+0.08
3.46%
1 jan 2015 ano
2.309
-0.091
-3.78%
Classificação de países por estatísticas atuais por anos


Comentários: