29
/pt/
pt
AIzaSyAYiBZKx7MnpbEhh9jyipgxe19OcubqV5w
April 1, 2024
116011
Cuba
CUB
true
2
1
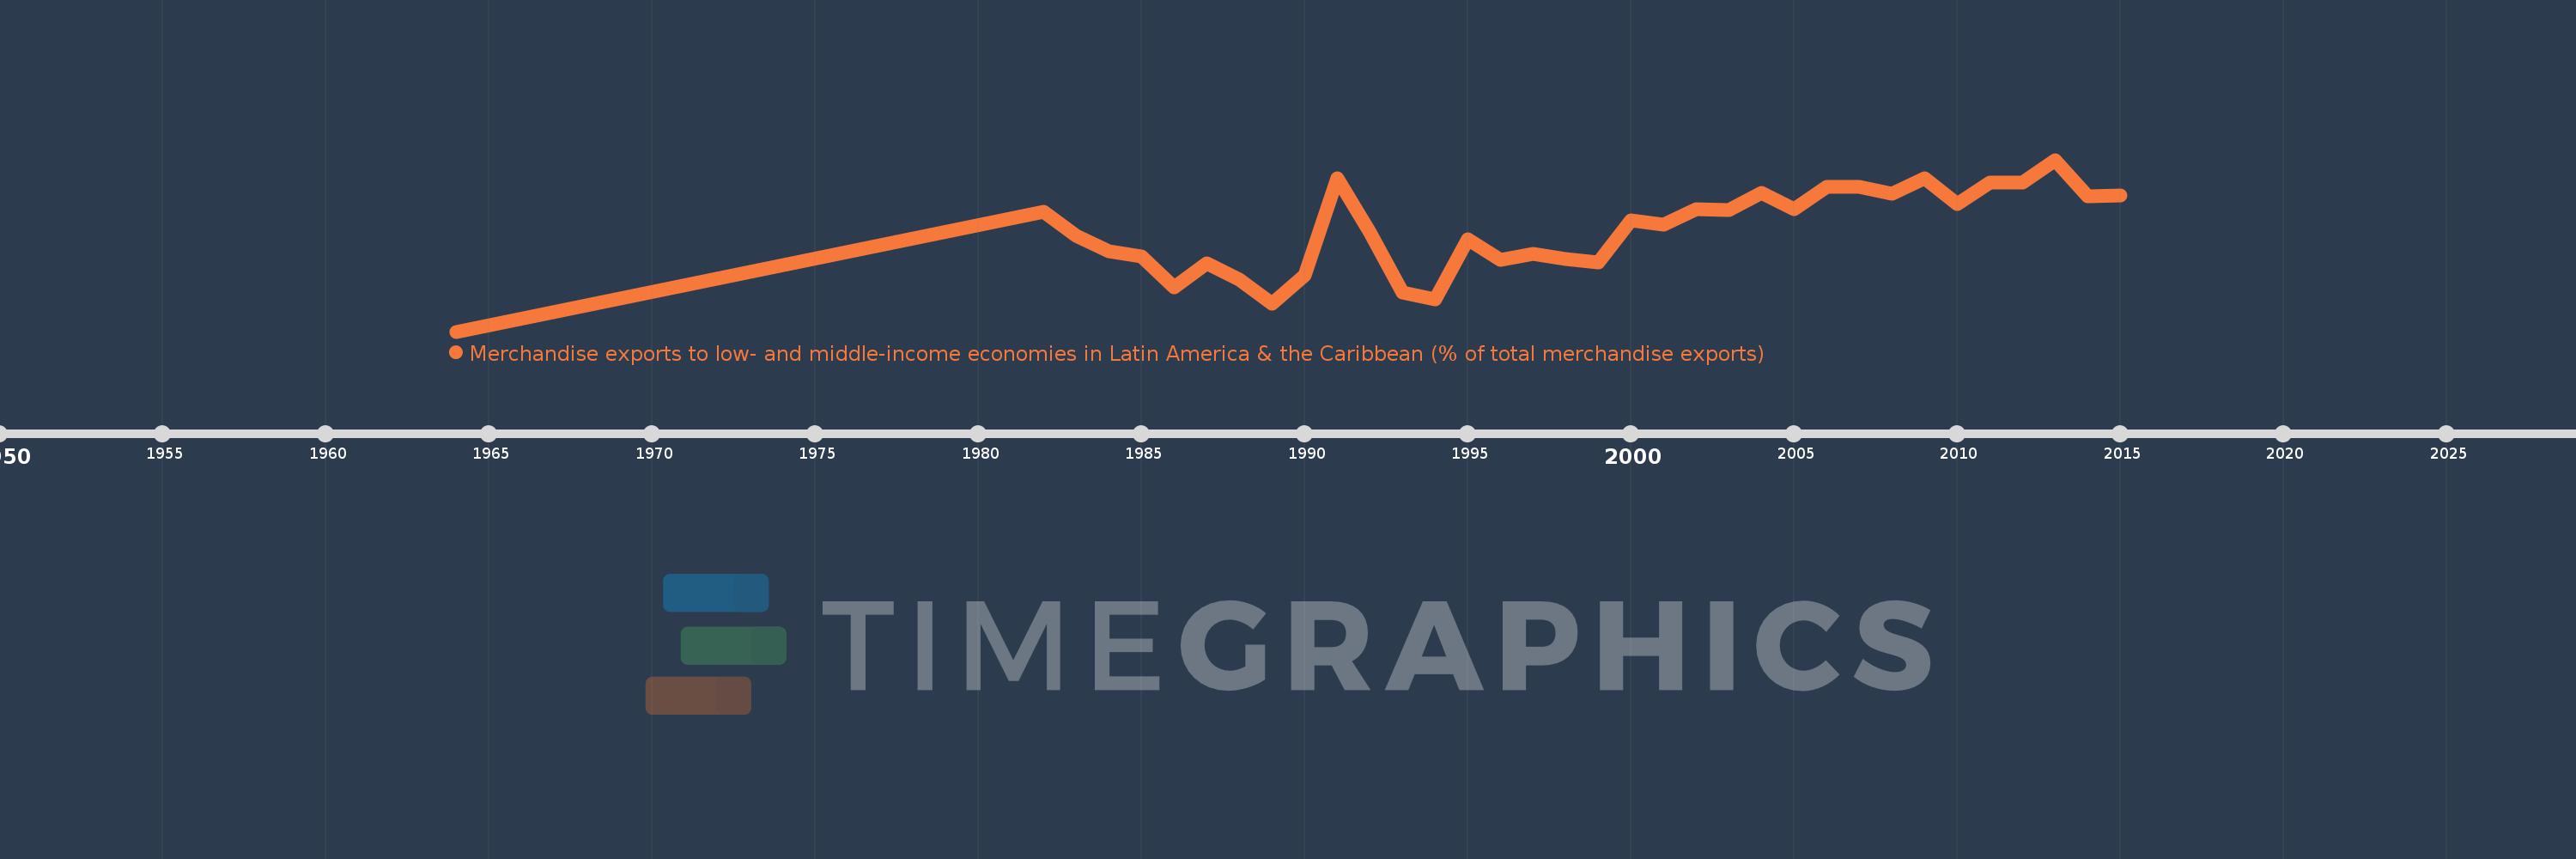
Merchandise exports to low- and middle-income economies in Latin America & the Caribbean (% of total merchandise exports)
2015,2014,2013,2012,2011,2010,2009,2008,2007,2006,2005,2004,2003,2002,2001,2000,1999,1998,1997,1996,1995,1994,1993,1992,1991,1990,1989,1988,1987,1986,1985,1984,1983,1982,1964
Estas estatísticas em outros países:
AfghanistanAlbaniaAlgeriaAngolaAntigua and BarbudaArab WorldArgentinaArmeniaArubaAustraliaAustriaAzerbaijanBahamas, TheBahrainBangladeshBarbadosBelarusBelgiumBelizeBeninBermudaBoliviaBrazilBrunei DarussalamBulgariaBurundiCabo VerdeCambodiaCameroonCanadaCaribbean small statesCentral African RepublicCentral Europe and the BalticsChileChinaColombiaCongo, Dem. Rep.Congo, Rep.Costa RicaCote d'IvoireCroatiaCubaCyprusCzech RepublicDenmarkDominicaDominican RepublicEarly-demographic dividendEast Asia & PacificEast Asia & Pacific (excluding high income)East Asia & Pacific (IDA & IBRD countries)EcuadorEgypt, Arab Rep.El SalvadorEstoniaEthiopiaEuro areaEurope & Central AsiaEurope & Central Asia (excluding high income)Europe & Central Asia (IDA & IBRD countries)European UnionFaroe IslandsFijiFinlandFragile and conflict affected situationsFranceFrench PolynesiaGabonGambia, TheGeorgiaGermanyGhanaGibraltarGreeceGreenlandGrenadaGuatemalaGuineaGuyanaHaitiHeavily indebted poor countries (HIPC)High incomeHondurasHong Kong SAR, ChinaHungaryIBRD onlyIcelandIDA & IBRD totalIDA blendIDA onlyIDA totalIndiaIndonesiaIran, Islamic Rep.IraqIrelandIsraelItalyJamaicaJapanJordanKazakhstanKenyaKorea, Dem. People’s Rep.Korea, Rep.KuwaitLao PDRLate-demographic dividendLatin America & Caribbean Latin America & Caribbean (excluding high income)Latin America & the Caribbean (IDA & IBRD countries)LatviaLeast developed countries: UN classificationLebanonLiberiaLibyaLithuaniaLow & middle incomeLow incomeLower middle incomeLuxembourgMacao SAR, ChinaMacedonia, FYRMadagascarMalawiMalaysiaMaliMaltaMauritaniaMauritiusMexicoMiddle East & North AfricaMiddle East & North Africa (excluding high income)Middle East & North Africa (IDA & IBRD countries)Middle incomeMongoliaMontenegroMoroccoMozambiqueMyanmarNetherlandsNew CaledoniaNew ZealandNicaraguaNigerNigeriaNorth AmericaNorwayOECD membersOmanOther small statesPacific island small statesPakistanPanamaPapua New GuineaParaguayPeruPhilippinesPolandPortugalPost-demographic dividendPre-demographic dividendQatarRomaniaRussian FederationRwandaSamoaSaudi ArabiaSenegalSerbiaSierra LeoneSingaporeSlovak RepublicSloveniaSmall statesSomaliaSouth AfricaSouth AsiaSouth Asia (IDA & IBRD)SpainSri LankaSt. Kitts and NevisSt. LuciaSt. Vincent and the GrenadinesSub-Saharan Africa Sub-Saharan Africa (excluding high income)Sub-Saharan Africa (IDA & IBRD countries)SudanSurinameSwedenSwitzerlandSyrian Arab RepublicTanzaniaThailandTogoTrinidad and TobagoTunisiaTurkeyUgandaUkraineUnited Arab EmiratesUnited KingdomUnited StatesUpper middle incomeUruguayVenezuela, RBVietnamWorldYemen, Rep.ZambiaZimbabwe Linha do tempo:
Nesta escala de tempo está apresentado um gráfico de 1964 ano até 2015 ano Cuba. Dados de 1963 ano ausente. O número de observações reais por data: 35.
Fonte (nome):
Indicadores de desenvolvimento mundial
Fonte (organização):
World Bank staff estimates based data from International Monetary Fund's Direction of Trade database.
Categorias:
Private Sector, Trade
Foi atualizado:
23 abr 2017 ano
Indicadores de alterações dos valores ao longo dos anos
Máximo:
13.112
1 jan 2013 ano
Na data de observação
Valor
Mudança absoluta
A alteração em relação ao valor anterior
1 jan 1964 ano
0.0
0.0
0.0%
1 jan 1982 ano
9.154
+9.154
%
1 jan 1983 ano
7.34
-1.813
-19.81%
1 jan 1984 ano
6.145
-1.195
-16.29%
1 jan 1985 ano
5.711
-0.434
-7.07%
1 jan 1986 ano
3.356
-2.354
-41.23%
1 jan 1987 ano
5.197
+1.841
54.84%
1 jan 1988 ano
3.98
-1.217
-23.42%
1 jan 1989 ano
2.103
-1.876
-47.15%
1 jan 1990 ano
4.271
+2.168
103.07%
1 jan 1991 ano
11.722
+7.451
174.44%
1 jan 1992 ano
7.595
-4.127
-35.21%
1 jan 1993 ano
3.011
-4.583
-60.35%
1 jan 1994 ano
2.44
-0.572
-18.98%
1 jan 1995 ano
7.028
+4.588
188.06%
1 jan 1996 ano
5.497
-1.531
-21.78%
1 jan 1997 ano
5.93
+0.433
7.87%
1 jan 1998 ano
5.549
-0.381
-6.42%
1 jan 1999 ano
5.269
-0.28
-5.04%
1 jan 2000 ano
8.483
+3.214
61.0%
1 jan 2001 ano
8.175
-0.308
-3.63%
1 jan 2002 ano
9.312
+1.137
13.91%
1 jan 2003 ano
9.264
-0.048
-0.52%
1 jan 2004 ano
10.589
+1.325
14.3%
1 jan 2005 ano
9.353
-1.236
-11.67%
1 jan 2006 ano
11.027
+1.674
17.9%
1 jan 2007 ano
11.071
+0.045
0.4%
1 jan 2008 ano
10.505
-0.567
-5.12%
1 jan 2009 ano
11.692
+1.187
11.3%
1 jan 2010 ano
9.726
-1.966
-16.82%
1 jan 2011 ano
11.384
+1.658
17.05%
1 jan 2012 ano
11.357
-0.027
-0.24%
1 jan 2013 ano
13.112
+1.755
15.46%
1 jan 2014 ano
10.347
-2.765
-21.09%
1 jan 2015 ano
10.361
+0.015
0.14%
Classificação de países por estatísticas atuais por anos


Comentários: