29
/pt/
pt
AIzaSyAYiBZKx7MnpbEhh9jyipgxe19OcubqV5w
April 1, 2024
50210
Middle East & North Africa (IDA & IBRD countries)
TMN
false
2
1
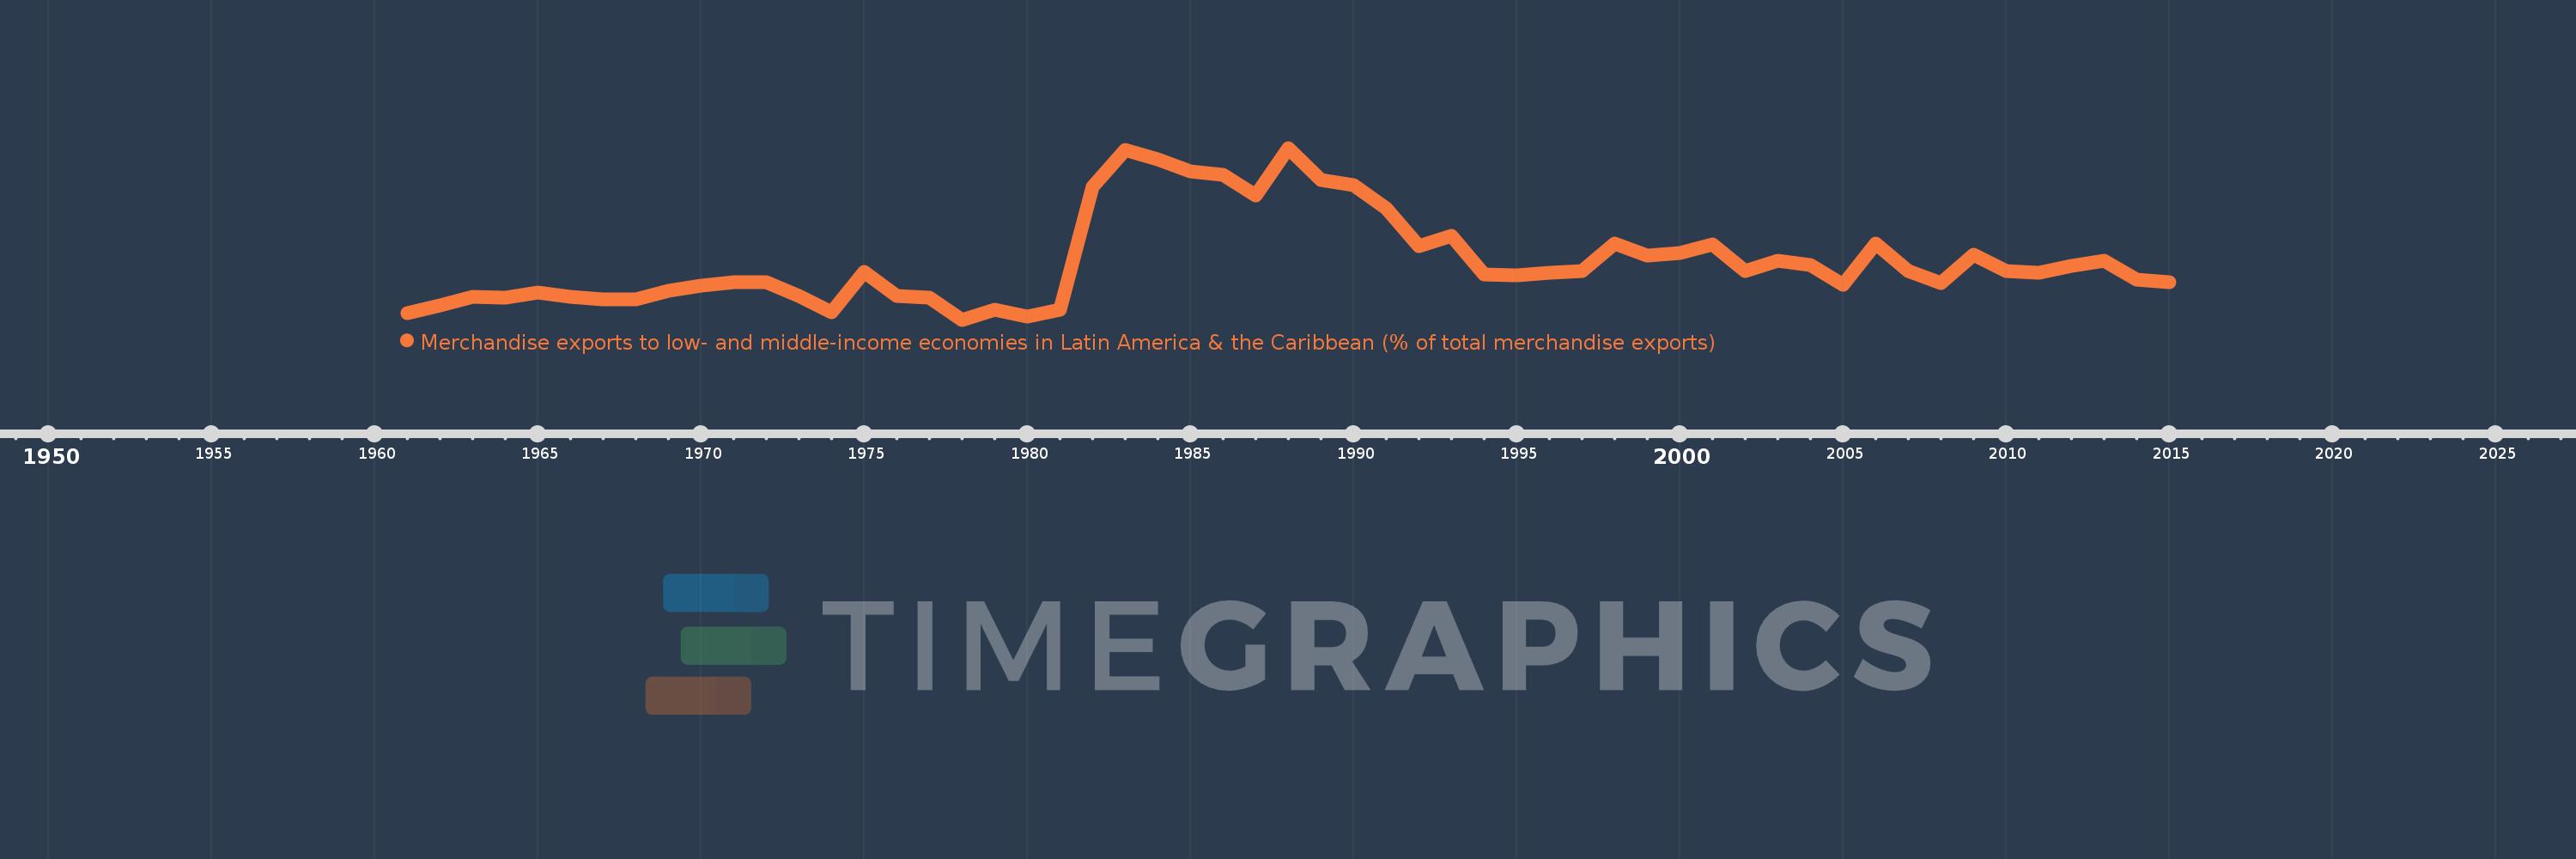
Merchandise exports to low- and middle-income economies in Latin America & the Caribbean (% of total merchandise exports)
2015,2014,2013,2012,2011,2010,2009,2008,2007,2006,2005,2004,2003,2002,2001,2000,1999,1998,1997,1996,1995,1994,1993,1992,1991,1990,1989,1988,1987,1986,1985,1984,1983,1982,1981,1980,1979,1978,1977,1976,1975,1974,1973,1972,1971,1970,1969,1968,1967,1966,1965,1964,1963,1962,1961
Estas estatísticas em outros países:
AfghanistanAlbaniaAlgeriaAngolaAntigua and BarbudaArab WorldArgentinaArmeniaArubaAustraliaAustriaAzerbaijanBahamas, TheBahrainBangladeshBarbadosBelarusBelgiumBelizeBeninBermudaBoliviaBrazilBrunei DarussalamBulgariaBurundiCabo VerdeCambodiaCameroonCanadaCaribbean small statesCentral African RepublicCentral Europe and the BalticsChileChinaColombiaCongo, Dem. Rep.Congo, Rep.Costa RicaCote d'IvoireCroatiaCubaCyprusCzech RepublicDenmarkDominicaDominican RepublicEarly-demographic dividendEast Asia & PacificEast Asia & Pacific (excluding high income)East Asia & Pacific (IDA & IBRD countries)EcuadorEgypt, Arab Rep.El SalvadorEstoniaEthiopiaEuro areaEurope & Central AsiaEurope & Central Asia (excluding high income)Europe & Central Asia (IDA & IBRD countries)European UnionFaroe IslandsFijiFinlandFragile and conflict affected situationsFranceFrench PolynesiaGabonGambia, TheGeorgiaGermanyGhanaGibraltarGreeceGreenlandGrenadaGuatemalaGuineaGuyanaHaitiHeavily indebted poor countries (HIPC)High incomeHondurasHong Kong SAR, ChinaHungaryIBRD onlyIcelandIDA & IBRD totalIDA blendIDA onlyIDA totalIndiaIndonesiaIran, Islamic Rep.IraqIrelandIsraelItalyJamaicaJapanJordanKazakhstanKenyaKorea, Dem. People’s Rep.Korea, Rep.KuwaitLao PDRLate-demographic dividendLatin America & Caribbean Latin America & Caribbean (excluding high income)Latin America & the Caribbean (IDA & IBRD countries)LatviaLeast developed countries: UN classificationLebanonLiberiaLibyaLithuaniaLow & middle incomeLow incomeLower middle incomeLuxembourgMacao SAR, ChinaMacedonia, FYRMadagascarMalawiMalaysiaMaliMaltaMauritaniaMauritiusMexicoMiddle East & North AfricaMiddle East & North Africa (excluding high income)Middle East & North Africa (IDA & IBRD countries)Middle incomeMongoliaMontenegroMoroccoMozambiqueMyanmarNetherlandsNew CaledoniaNew ZealandNicaraguaNigerNigeriaNorth AmericaNorwayOECD membersOmanOther small statesPacific island small statesPakistanPanamaPapua New GuineaParaguayPeruPhilippinesPolandPortugalPost-demographic dividendPre-demographic dividendQatarRomaniaRussian FederationRwandaSamoaSaudi ArabiaSenegalSerbiaSierra LeoneSingaporeSlovak RepublicSloveniaSmall statesSomaliaSouth AfricaSouth AsiaSouth Asia (IDA & IBRD)SpainSri LankaSt. Kitts and NevisSt. LuciaSt. Vincent and the GrenadinesSub-Saharan Africa Sub-Saharan Africa (excluding high income)Sub-Saharan Africa (IDA & IBRD countries)SudanSurinameSwedenSwitzerlandSyrian Arab RepublicTanzaniaThailandTogoTrinidad and TobagoTunisiaTurkeyUgandaUkraineUnited Arab EmiratesUnited KingdomUnited StatesUpper middle incomeUruguayVenezuela, RBVietnamWorldYemen, Rep.ZambiaZimbabwe Linha do tempo:
Nesta escala de tempo está apresentado um gráfico de 1961 ano até 2015 ano Middle East & North Africa (IDA & IBRD countries). Dados de 1960 ano ausente. O número de observações reais por data: 55.
Fonte (nome):
Indicadores de desenvolvimento mundial
Fonte (organização):
World Bank staff estimates based data from International Monetary Fund's Direction of Trade database.
Categorias:
Private Sector, Trade
Foi atualizado:
23 abr 2017 ano
Indicadores de alterações dos valores ao longo dos anos
Mínimo:
0.318
1 jan 1978 ano
Máximo:
4.475
1 jan 1988 ano
Na data de observação
Valor
Mudança absoluta
A alteração em relação ao valor anterior
1 jan 1961 ano
0.486
+0.486
0.0%
1 jan 1962 ano
0.666
+0.18
37.15%
1 jan 1963 ano
0.864
+0.197
29.62%
1 jan 1964 ano
0.848
-0.015
-1.77%
1 jan 1965 ano
0.983
+0.134
15.82%
1 jan 1966 ano
0.867
-0.116
-11.8%
1 jan 1967 ano
0.806
-0.061
-7.01%
1 jan 1968 ano
0.807
+0.001
0.09%
1 jan 1969 ano
1.018
+0.211
26.18%
1 jan 1970 ano
1.133
+0.115
11.29%
1 jan 1971 ano
1.231
+0.099
8.7%
1 jan 1972 ano
1.227
-0.004
-0.36%
1 jan 1973 ano
0.899
-0.328
-26.7%
1 jan 1974 ano
0.497
-0.402
-44.72%
1 jan 1975 ano
1.479
+0.982
197.54%
1 jan 1976 ano
0.884
-0.595
-40.25%
1 jan 1977 ano
0.858
-0.026
-2.92%
1 jan 1978 ano
0.318
-0.54
-62.94%
1 jan 1979 ano
0.566
+0.248
78.03%
1 jan 1980 ano
0.396
-0.17
-30.12%
1 jan 1981 ano
0.569
+0.173
43.81%
1 jan 1982 ano
3.541
+2.972
522.49%
1 jan 1983 ano
4.431
+0.89
25.13%
1 jan 1984 ano
4.193
-0.238
-5.36%
1 jan 1985 ano
3.9
-0.293
-6.99%
1 jan 1986 ano
3.818
-0.082
-2.1%
1 jan 1987 ano
3.33
-0.488
-12.78%
1 jan 1988 ano
4.475
+1.145
34.37%
1 jan 1989 ano
3.706
-0.769
-17.18%
1 jan 1990 ano
3.566
-0.14
-3.78%
1 jan 1991 ano
3.019
-0.547
-15.34%
1 jan 1992 ano
2.1
-0.919
-30.45%
1 jan 1993 ano
2.355
+0.256
12.19%
1 jan 1994 ano
1.419
-0.937
-39.77%
1 jan 1995 ano
1.383
-0.036
-2.53%
1 jan 1996 ano
1.445
+0.063
4.52%
1 jan 1997 ano
1.502
+0.056
3.89%
1 jan 1998 ano
2.155
+0.653
43.49%
1 jan 1999 ano
1.861
-0.293
-13.61%
1 jan 2000 ano
1.923
+0.062
3.33%
1 jan 2001 ano
2.143
+0.22
11.42%
1 jan 2002 ano
1.498
-0.644
-30.07%
1 jan 2003 ano
1.752
+0.253
16.9%
1 jan 2004 ano
1.644
-0.107
-6.12%
1 jan 2005 ano
1.156
-0.488
-29.71%
1 jan 2006 ano
2.153
+0.997
86.25%
1 jan 2007 ano
1.489
-0.664
-30.86%
1 jan 2008 ano
1.214
-0.274
-18.42%
1 jan 2009 ano
1.901
+0.686
56.5%
1 jan 2010 ano
1.501
-0.4
-21.02%
1 jan 2011 ano
1.446
-0.056
-3.7%
1 jan 2012 ano
1.627
+0.182
12.57%
1 jan 2013 ano
1.747
+0.12
7.38%
1 jan 2014 ano
1.29
-0.458
-26.19%
1 jan 2015 ano
1.231
-0.058
-4.53%
Classificação de países por estatísticas atuais por anos


Comentários: