29
/pt/
pt
AIzaSyAYiBZKx7MnpbEhh9jyipgxe19OcubqV5w
April 1, 2024
84397
Benin
BEN
true
2
1
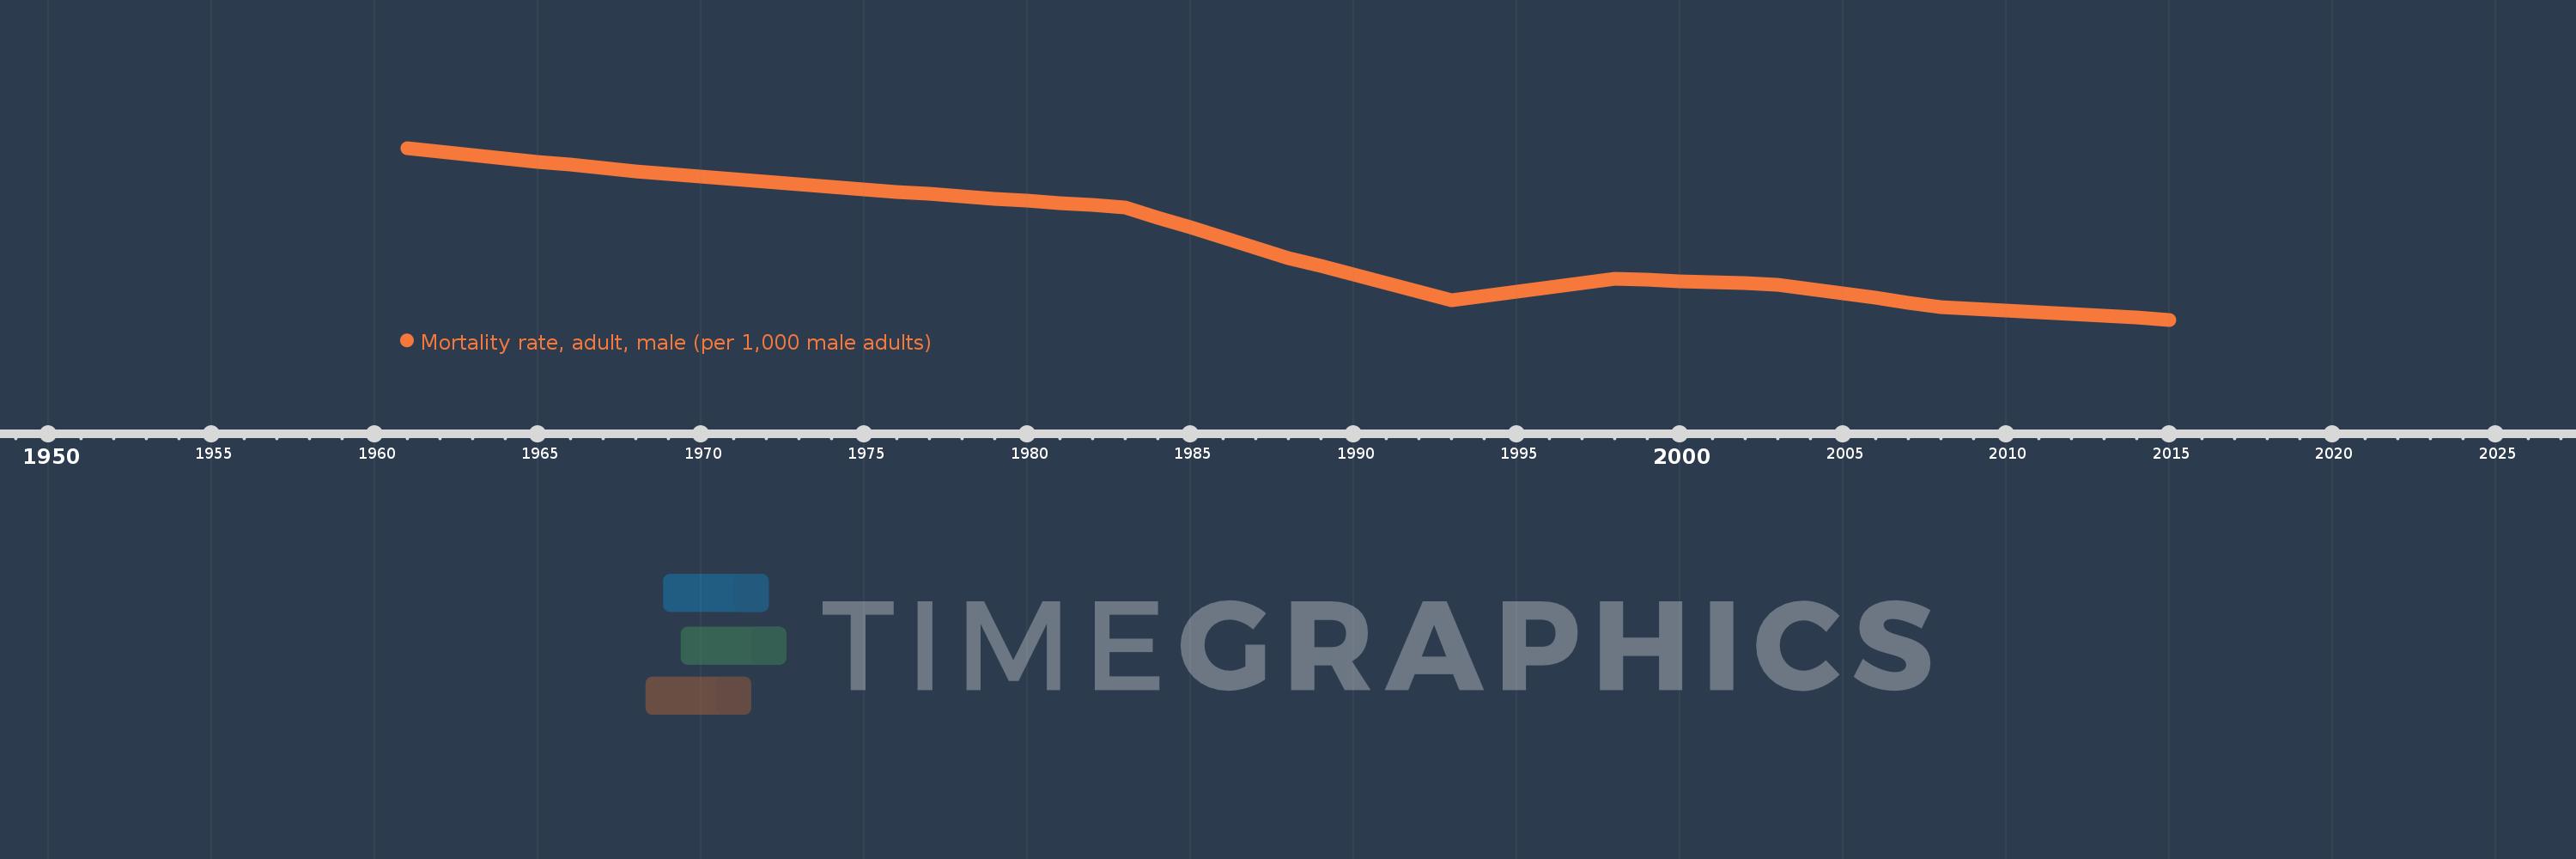
Mortality rate, adult, male (per 1,000 male adults)
2015,2014,2013,2012,2011,2010,2009,2008,2007,2006,2005,2004,2003,2002,2001,2000,1999,1998,1997,1996,1995,1994,1993,1992,1991,1990,1989,1988,1987,1986,1985,1984,1983,1982,1981,1980,1979,1978,1977,1976,1975,1974,1973,1972,1971,1970,1969,1968,1967,1966,1965,1964,1963,1962,1961
Estas estatísticas em outros países:
AfghanistanAlbaniaAlgeriaAngolaAntigua and BarbudaArab WorldArgentinaArmeniaArubaAustraliaAustriaAzerbaijanBahamas, TheBahrainBangladeshBarbadosBelarusBelgiumBelizeBeninBhutanBoliviaBosnia and HerzegovinaBotswanaBrazilBrunei DarussalamBulgariaBurkina FasoBurundiCabo VerdeCambodiaCameroonCanadaCaribbean small statesCentral African RepublicCentral Europe and the BalticsChadChannel IslandsChileChinaColombiaComorosCongo, Dem. Rep.Congo, Rep.Costa RicaCote d'IvoireCroatiaCubaCuracaoCyprusCzech RepublicDenmarkDjiboutiDominicaDominican RepublicEarly-demographic dividendEast Asia & PacificEast Asia & Pacific (excluding high income)East Asia & Pacific (IDA & IBRD countries)EcuadorEgypt, Arab Rep.El SalvadorEquatorial GuineaEritreaEstoniaEthiopiaEuro areaEurope & Central AsiaEurope & Central Asia (excluding high income)Europe & Central Asia (IDA & IBRD countries)European UnionFijiFinlandFragile and conflict affected situationsFranceFrench PolynesiaGabonGambia, TheGeorgiaGermanyGhanaGreeceGreenlandGrenadaGuamGuatemalaGuineaGuinea-BissauGuyanaHaitiHeavily indebted poor countries (HIPC)High incomeHondurasHong Kong SAR, ChinaHungaryIBRD onlyIcelandIDA & IBRD totalIDA blendIDA onlyIDA totalIndiaIndonesiaIran, Islamic Rep.IraqIrelandIsraelItalyJamaicaJapanJordanKazakhstanKenyaKiribatiKorea, Dem. People’s Rep.Korea, Rep.KuwaitKyrgyz RepublicLao PDRLate-demographic dividendLatin America & Caribbean Latin America & Caribbean (excluding high income)Latin America & the Caribbean (IDA & IBRD countries)LatviaLeast developed countries: UN classificationLebanonLesothoLiberiaLibyaLithuaniaLow & middle incomeLow incomeLower middle incomeLuxembourgMacao SAR, ChinaMacedonia, FYRMadagascarMalawiMalaysiaMaldivesMaliMaltaMarshall IslandsMauritaniaMauritiusMexicoMicronesia, Fed. Sts.Middle East & North AfricaMiddle East & North Africa (excluding high income)Middle East & North Africa (IDA & IBRD countries)Middle incomeMoldovaMongoliaMontenegroMoroccoMozambiqueMyanmarNamibiaNepalNetherlandsNew CaledoniaNew ZealandNicaraguaNigerNigeriaNorth AmericaNorwayOECD membersOmanOther small statesPacific island small statesPakistanPanamaPapua New GuineaParaguayPeruPhilippinesPolandPortugalPost-demographic dividendPre-demographic dividendPuerto RicoQatarRomaniaRussian FederationRwandaSamoaSao Tome and PrincipeSaudi ArabiaSenegalSerbiaSeychellesSierra LeoneSingaporeSlovak RepublicSloveniaSmall statesSolomon IslandsSomaliaSouth AfricaSouth AsiaSouth Asia (IDA & IBRD)South SudanSpainSri LankaSt. Kitts and NevisSt. LuciaSt. Vincent and the GrenadinesSub-Saharan Africa Sub-Saharan Africa (excluding high income)Sub-Saharan Africa (IDA & IBRD countries)SudanSurinameSwazilandSwedenSwitzerlandSyrian Arab RepublicTajikistanTanzaniaThailandTimor-LesteTogoTongaTrinidad and TobagoTunisiaTurkeyTurkmenistanUgandaUkraineUnited Arab EmiratesUnited KingdomUnited StatesUpper middle incomeUruguayUzbekistanVanuatuVenezuela, RBVietnamVirgin Islands (U.S.)West Bank and GazaWorldYemen, Rep.ZambiaZimbabwe Linha do tempo:
Nesta escala de tempo está apresentado um gráfico de 1961 ano até 2015 ano Benin. Dados de 1960 ano ausente. O número de observações reais por data: 55.
Fonte (nome):
Indicadores de desenvolvimento mundial
Fonte (organização):
(1) United Nations Population Division. World Population Prospects. New York, United Nations, Department of Economic and Social Affairs (advanced Excel tables). Available at http://esa.un.org/wpp/unpp/panel_population.htm, (2) University of California, Berkeley, and Max Planck Institute for Demographic Research. Human Mortality Database. [ www.mortality.org or www.humanmortality.de].
Categorias:
Health, Gender
Foi atualizado:
23 abr 2017 ano
Indicadores de alterações dos valores ao longo dos anos
Mínimo:
270.008
1 jan 2015 ano
Máximo:
473.237
1 jan 1961 ano
Na data de observação
Valor
Mudança absoluta
A alteração em relação ao valor anterior
1 jan 1961 ano
473.237
+473.237
0.0%
1 jan 1962 ano
469.18
-4.057
-0.86%
1 jan 1963 ano
465.123
-4.057
-0.86%
1 jan 1964 ano
461.133
-3.99
-0.86%
1 jan 1965 ano
457.143
-3.99
-0.87%
1 jan 1966 ano
453.153
-3.99
-0.87%
1 jan 1967 ano
449.163
-3.99
-0.88%
1 jan 1968 ano
445.173
-3.99
-0.89%
1 jan 1969 ano
442.136
-3.037
-0.68%
1 jan 1970 ano
439.098
-3.038
-0.69%
1 jan 1971 ano
436.061
-3.037
-0.69%
1 jan 1972 ano
433.023
-3.038
-0.7%
1 jan 1973 ano
429.985
-3.038
-0.7%
1 jan 1974 ano
427.168
-2.817
-0.66%
1 jan 1975 ano
424.352
-2.816
-0.66%
1 jan 1976 ano
421.535
-2.817
-0.66%
1 jan 1977 ano
418.718
-2.817
-0.67%
1 jan 1978 ano
415.901
-2.817
-0.67%
1 jan 1979 ano
413.308
-2.593
-0.62%
1 jan 1980 ano
410.716
-2.592
-0.63%
1 jan 1981 ano
408.123
-2.593
-0.63%
1 jan 1982 ano
405.531
-2.592
-0.64%
1 jan 1983 ano
402.938
-2.593
-0.64%
1 jan 1984 ano
391.017
-11.921
-2.96%
1 jan 1985 ano
379.097
-11.92
-3.05%
1 jan 1986 ano
367.176
-11.921
-3.14%
1 jan 1987 ano
355.255
-11.921
-3.25%
1 jan 1988 ano
343.334
-11.921
-3.36%
1 jan 1989 ano
333.244
-10.09
-2.94%
1 jan 1990 ano
323.155
-10.089
-3.03%
1 jan 1991 ano
313.065
-10.09
-3.12%
1 jan 1992 ano
302.975
-10.09
-3.22%
1 jan 1993 ano
292.885
-10.09
-3.33%
1 jan 1994 ano
298.047
+5.162
1.76%
1 jan 1995 ano
303.209
+5.162
1.73%
1 jan 1996 ano
308.371
+5.162
1.7%
1 jan 1997 ano
313.533
+5.162
1.67%
1 jan 1998 ano
318.695
+5.162
1.65%
1 jan 1999 ano
317.305
-1.39
-0.44%
1 jan 2000 ano
315.915
-1.39
-0.44%
1 jan 2001 ano
314.525
-1.39
-0.44%
1 jan 2002 ano
313.135
-1.39
-0.44%
1 jan 2003 ano
311.746
-1.389
-0.44%
1 jan 2004 ano
306.42
-5.326
-1.71%
1 jan 2005 ano
301.095
-5.325
-1.74%
1 jan 2006 ano
295.77
-5.325
-1.77%
1 jan 2007 ano
290.445
-5.325
-1.8%
1 jan 2008 ano
285.12
-5.325
-1.83%
1 jan 2009 ano
283.036
-2.084
-0.73%
1 jan 2010 ano
280.953
-2.083
-0.74%
1 jan 2011 ano
278.869
-2.084
-0.74%
1 jan 2012 ano
276.786
-2.083
-0.75%
1 jan 2013 ano
274.703
-2.083
-0.75%
1 jan 2014 ano
272.355
-2.348
-0.85%
1 jan 2015 ano
270.008
-2.347
-0.86%
Classificação de países por estatísticas atuais por anos


Comentários: