29
/pt/
pt
AIzaSyAYiBZKx7MnpbEhh9jyipgxe19OcubqV5w
April 1, 2024
133424
Finland
FIN
true
2
1
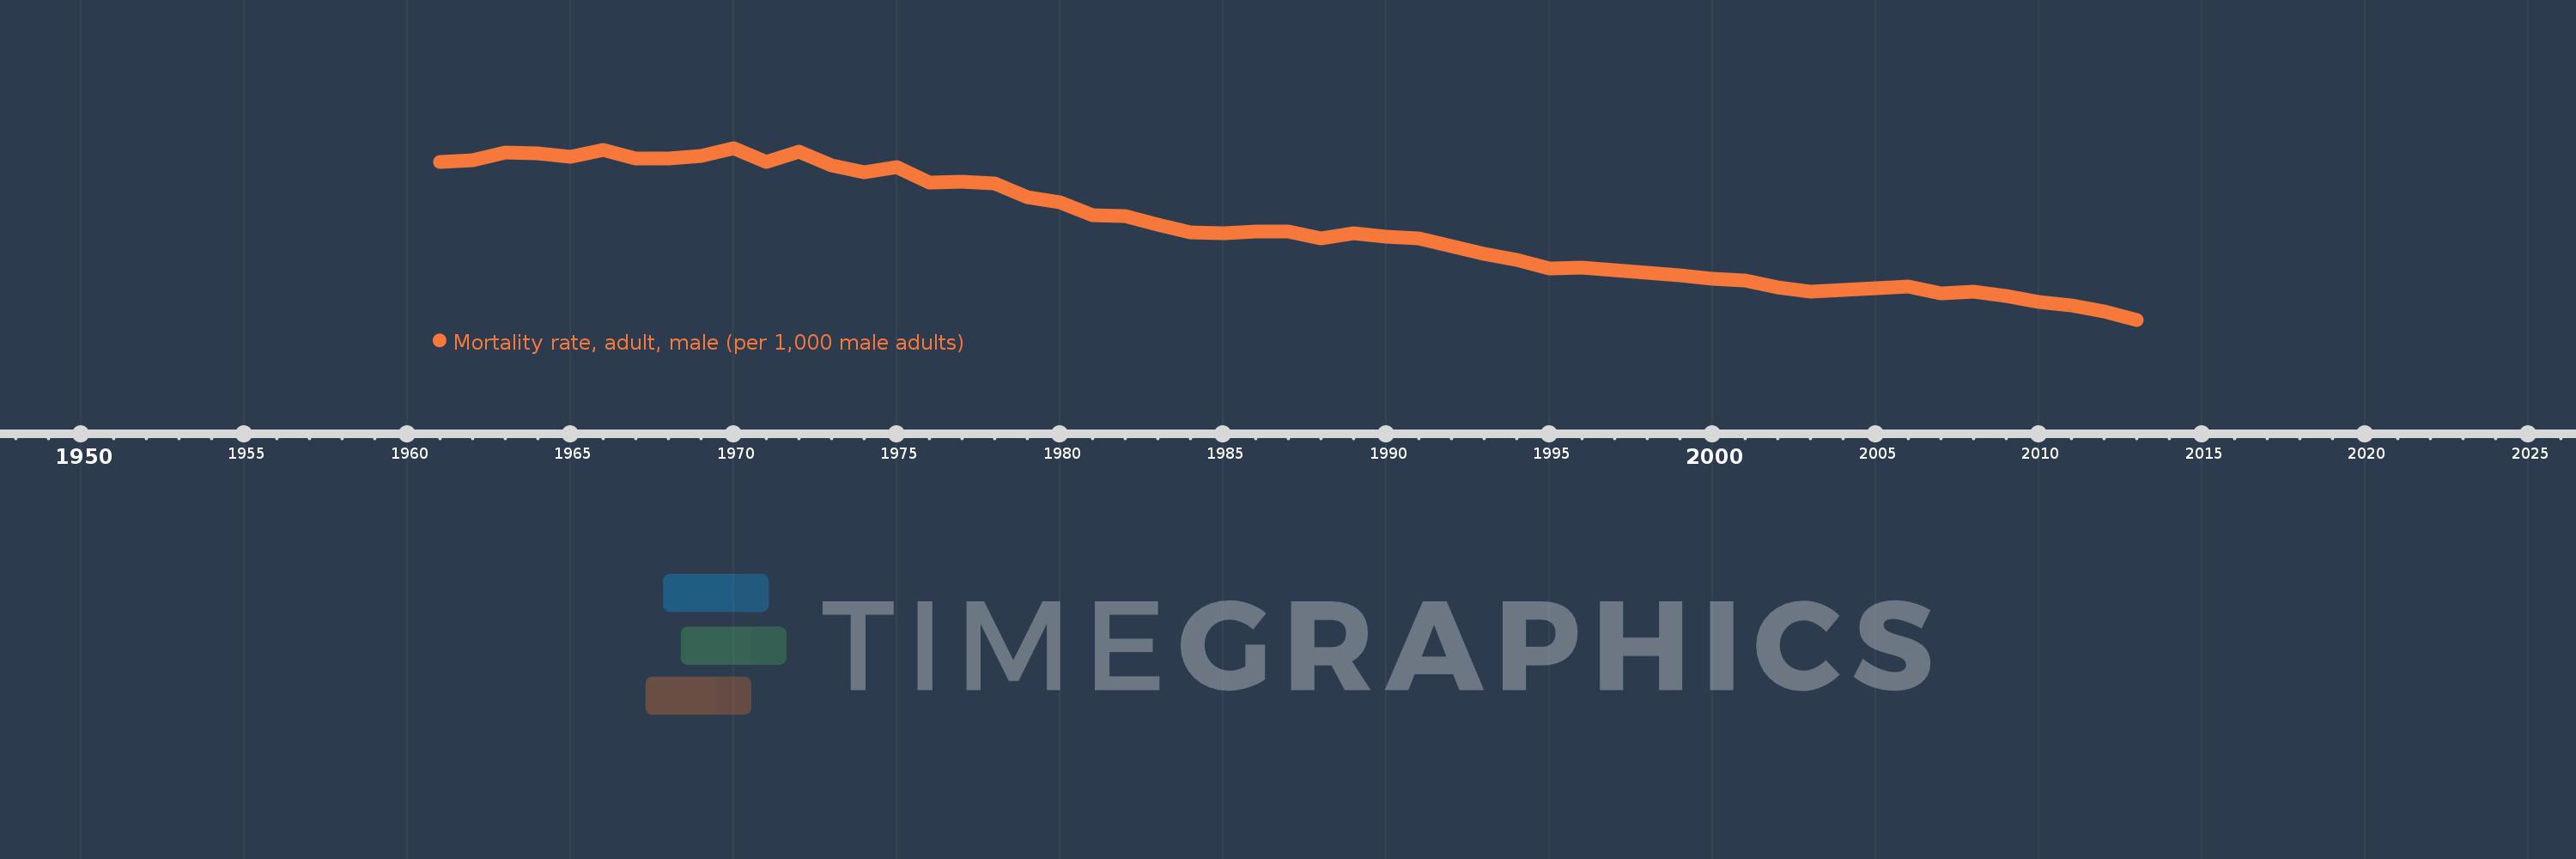
Mortality rate, adult, male (per 1,000 male adults)
2013,2012,2011,2010,2009,2008,2007,2006,2005,2004,2003,2002,2001,2000,1999,1998,1997,1996,1995,1994,1993,1992,1991,1990,1989,1988,1987,1986,1985,1984,1983,1982,1981,1980,1979,1978,1977,1976,1975,1974,1973,1972,1971,1970,1969,1968,1967,1966,1965,1964,1963,1962,1961
Estas estatísticas em outros países:
AfghanistanAlbaniaAlgeriaAngolaAntigua and BarbudaArab WorldArgentinaArmeniaArubaAustraliaAustriaAzerbaijanBahamas, TheBahrainBangladeshBarbadosBelarusBelgiumBelizeBeninBhutanBoliviaBosnia and HerzegovinaBotswanaBrazilBrunei DarussalamBulgariaBurkina FasoBurundiCabo VerdeCambodiaCameroonCanadaCaribbean small statesCentral African RepublicCentral Europe and the BalticsChadChannel IslandsChileChinaColombiaComorosCongo, Dem. Rep.Congo, Rep.Costa RicaCote d'IvoireCroatiaCubaCuracaoCyprusCzech RepublicDenmarkDjiboutiDominicaDominican RepublicEarly-demographic dividendEast Asia & PacificEast Asia & Pacific (excluding high income)East Asia & Pacific (IDA & IBRD countries)EcuadorEgypt, Arab Rep.El SalvadorEquatorial GuineaEritreaEstoniaEthiopiaEuro areaEurope & Central AsiaEurope & Central Asia (excluding high income)Europe & Central Asia (IDA & IBRD countries)European UnionFijiFinlandFragile and conflict affected situationsFranceFrench PolynesiaGabonGambia, TheGeorgiaGermanyGhanaGreeceGreenlandGrenadaGuamGuatemalaGuineaGuinea-BissauGuyanaHaitiHeavily indebted poor countries (HIPC)High incomeHondurasHong Kong SAR, ChinaHungaryIBRD onlyIcelandIDA & IBRD totalIDA blendIDA onlyIDA totalIndiaIndonesiaIran, Islamic Rep.IraqIrelandIsraelItalyJamaicaJapanJordanKazakhstanKenyaKiribatiKorea, Dem. People’s Rep.Korea, Rep.KuwaitKyrgyz RepublicLao PDRLate-demographic dividendLatin America & Caribbean Latin America & Caribbean (excluding high income)Latin America & the Caribbean (IDA & IBRD countries)LatviaLeast developed countries: UN classificationLebanonLesothoLiberiaLibyaLithuaniaLow & middle incomeLow incomeLower middle incomeLuxembourgMacao SAR, ChinaMacedonia, FYRMadagascarMalawiMalaysiaMaldivesMaliMaltaMarshall IslandsMauritaniaMauritiusMexicoMicronesia, Fed. Sts.Middle East & North AfricaMiddle East & North Africa (excluding high income)Middle East & North Africa (IDA & IBRD countries)Middle incomeMoldovaMongoliaMontenegroMoroccoMozambiqueMyanmarNamibiaNepalNetherlandsNew CaledoniaNew ZealandNicaraguaNigerNigeriaNorth AmericaNorwayOECD membersOmanOther small statesPacific island small statesPakistanPanamaPapua New GuineaParaguayPeruPhilippinesPolandPortugalPost-demographic dividendPre-demographic dividendPuerto RicoQatarRomaniaRussian FederationRwandaSamoaSao Tome and PrincipeSaudi ArabiaSenegalSerbiaSeychellesSierra LeoneSingaporeSlovak RepublicSloveniaSmall statesSolomon IslandsSomaliaSouth AfricaSouth AsiaSouth Asia (IDA & IBRD)South SudanSpainSri LankaSt. Kitts and NevisSt. LuciaSt. Vincent and the GrenadinesSub-Saharan Africa Sub-Saharan Africa (excluding high income)Sub-Saharan Africa (IDA & IBRD countries)SudanSurinameSwazilandSwedenSwitzerlandSyrian Arab RepublicTajikistanTanzaniaThailandTimor-LesteTogoTongaTrinidad and TobagoTunisiaTurkeyTurkmenistanUgandaUkraineUnited Arab EmiratesUnited KingdomUnited StatesUpper middle incomeUruguayUzbekistanVanuatuVenezuela, RBVietnamVirgin Islands (U.S.)West Bank and GazaWorldYemen, Rep.ZambiaZimbabwe Linha do tempo:
Nesta escala de tempo está apresentado um gráfico de 1961 ano até 2013 ano Finland. Dados de 1960 ano ausente. O número de observações reais por data: 53.
Fonte (nome):
Indicadores de desenvolvimento mundial
Fonte (organização):
(1) United Nations Population Division. World Population Prospects. New York, United Nations, Department of Economic and Social Affairs (advanced Excel tables). Available at http://esa.un.org/wpp/unpp/panel_population.htm, (2) University of California, Berkeley, and Max Planck Institute for Demographic Research. Human Mortality Database. [ www.mortality.org or www.humanmortality.de].
Categorias:
Health, Gender
Foi atualizado:
23 abr 2017 ano
Indicadores de alterações dos valores ao longo dos anos
Mínimo:
107.455
1 jan 2013 ano
Máximo:
266.881
1 jan 1970 ano
Na data de observação
Valor
Mudança absoluta
A alteração em relação ao valor anterior
1 jan 1961 ano
254.022
+254.022
0.0%
1 jan 1962 ano
255.167
+1.145
0.45%
1 jan 1963 ano
262.454
+7.287
2.86%
1 jan 1964 ano
261.757
-0.697
-0.27%
1 jan 1965 ano
258.508
-3.249
-1.24%
1 jan 1966 ano
265.174
+6.666
2.58%
1 jan 1967 ano
257.084
-8.09
-3.05%
1 jan 1968 ano
257.357
+0.273
0.11%
1 jan 1969 ano
259.512
+2.155
0.84%
1 jan 1970 ano
266.881
+7.369
2.84%
1 jan 1971 ano
254.052
-12.829
-4.81%
1 jan 1972 ano
263.41
+9.358
3.68%
1 jan 1973 ano
250.972
-12.438
-4.72%
1 jan 1974 ano
244.615
-6.357
-2.53%
1 jan 1975 ano
248.913
+4.298
1.76%
1 jan 1976 ano
234.771
-14.142
-5.68%
1 jan 1977 ano
235.952
+1.181
0.5%
1 jan 1978 ano
233.739
-2.213
-0.94%
1 jan 1979 ano
221.432
-12.307
-5.27%
1 jan 1980 ano
216.397
-5.035
-2.27%
1 jan 1981 ano
204.146
-12.251
-5.66%
1 jan 1982 ano
203.756
-0.39
-0.19%
1 jan 1983 ano
195.358
-8.398
-4.12%
1 jan 1984 ano
188.582
-6.776
-3.47%
1 jan 1985 ano
187.789
-0.793
-0.42%
1 jan 1986 ano
189.028
+1.239
0.66%
1 jan 1987 ano
189.044
+0.016
0.01%
1 jan 1988 ano
182.931
-6.113
-3.23%
1 jan 1989 ano
188.025
+5.094
2.78%
1 jan 1990 ano
184.275
-3.75
-1.99%
1 jan 1991 ano
182.93
-1.345
-0.73%
1 jan 1992 ano
175.437
-7.493
-4.1%
1 jan 1993 ano
168.722
-6.715
-3.83%
1 jan 1994 ano
162.765
-5.957
-3.53%
1 jan 1995 ano
154.653
-8.112
-4.98%
1 jan 1996 ano
156.221
+1.568
1.01%
1 jan 1997 ano
153.757
-2.464
-1.58%
1 jan 1998 ano
150.974
-2.783
-1.81%
1 jan 1999 ano
148.686
-2.288
-1.52%
1 jan 2000 ano
145.418
-3.268
-2.2%
1 jan 2001 ano
143.868
-1.55
-1.07%
1 jan 2002 ano
137.62
-6.248
-4.34%
1 jan 2003 ano
133.481
-4.139
-3.01%
1 jan 2004 ano
134.804
+1.323
0.99%
1 jan 2005 ano
136.354
+1.55
1.15%
1 jan 2006 ano
137.949
+1.595
1.17%
1 jan 2007 ano
132.287
-5.662
-4.1%
1 jan 2008 ano
133.359
+1.072
0.81%
1 jan 2009 ano
129.187
-4.172
-3.13%
1 jan 2010 ano
123.833
-5.354
-4.14%
1 jan 2011 ano
120.376
-3.457
-2.79%
1 jan 2012 ano
115.067
-5.309
-4.41%
1 jan 2013 ano
107.455
-7.612
-6.62%
Classificação de países por estatísticas atuais por anos


Comentários: