29
/pt/
pt
AIzaSyAYiBZKx7MnpbEhh9jyipgxe19OcubqV5w
April 1, 2024
203223
Mozambique
MOZ
true
2
1
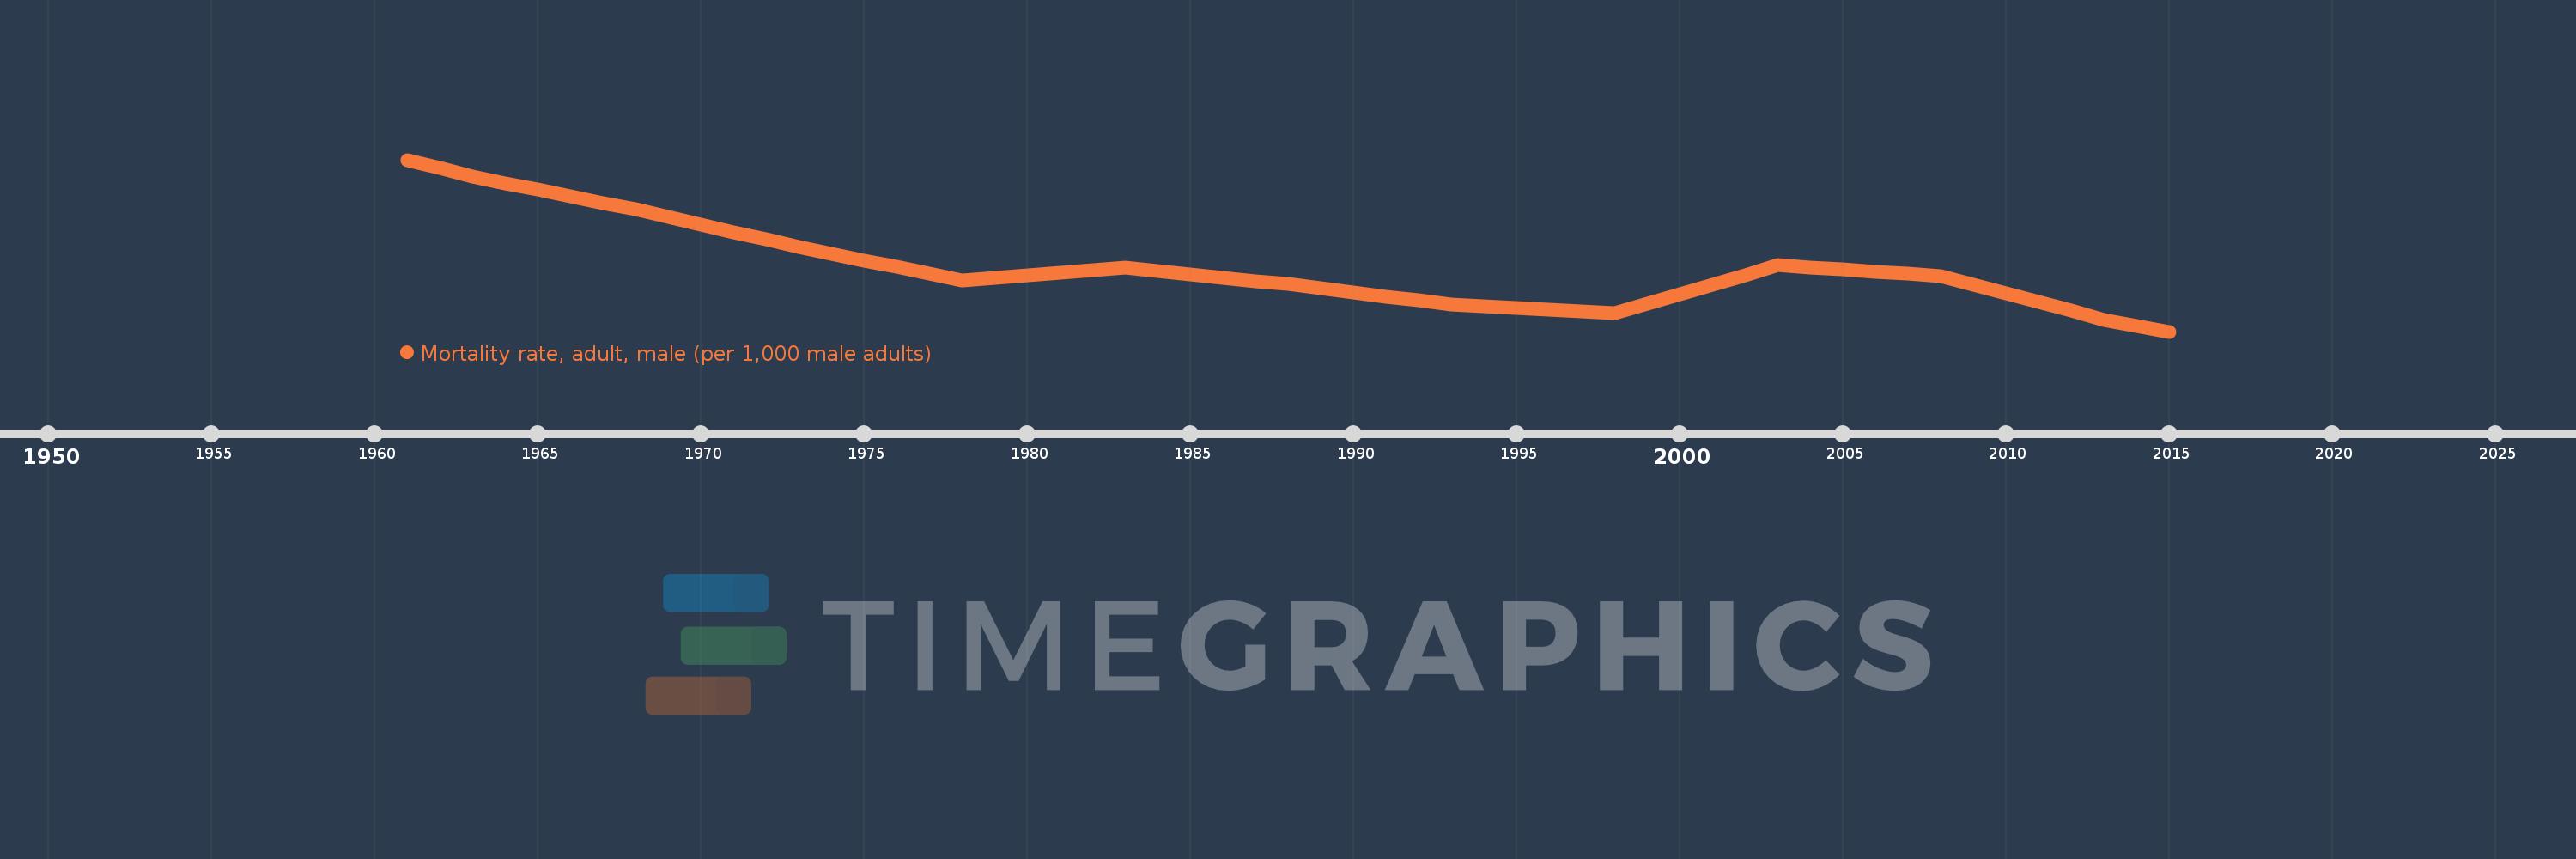
Mortality rate, adult, male (per 1,000 male adults)
2015,2014,2013,2012,2011,2010,2009,2008,2007,2006,2005,2004,2003,2002,2001,2000,1999,1998,1997,1996,1995,1994,1993,1992,1991,1990,1989,1988,1987,1986,1985,1984,1983,1982,1981,1980,1979,1978,1977,1976,1975,1974,1973,1972,1971,1970,1969,1968,1967,1966,1965,1964,1963,1962,1961
Estas estatísticas em outros países:
AfghanistanAlbaniaAlgeriaAngolaAntigua and BarbudaArab WorldArgentinaArmeniaArubaAustraliaAustriaAzerbaijanBahamas, TheBahrainBangladeshBarbadosBelarusBelgiumBelizeBeninBhutanBoliviaBosnia and HerzegovinaBotswanaBrazilBrunei DarussalamBulgariaBurkina FasoBurundiCabo VerdeCambodiaCameroonCanadaCaribbean small statesCentral African RepublicCentral Europe and the BalticsChadChannel IslandsChileChinaColombiaComorosCongo, Dem. Rep.Congo, Rep.Costa RicaCote d'IvoireCroatiaCubaCuracaoCyprusCzech RepublicDenmarkDjiboutiDominicaDominican RepublicEarly-demographic dividendEast Asia & PacificEast Asia & Pacific (excluding high income)East Asia & Pacific (IDA & IBRD countries)EcuadorEgypt, Arab Rep.El SalvadorEquatorial GuineaEritreaEstoniaEthiopiaEuro areaEurope & Central AsiaEurope & Central Asia (excluding high income)Europe & Central Asia (IDA & IBRD countries)European UnionFijiFinlandFragile and conflict affected situationsFranceFrench PolynesiaGabonGambia, TheGeorgiaGermanyGhanaGreeceGreenlandGrenadaGuamGuatemalaGuineaGuinea-BissauGuyanaHaitiHeavily indebted poor countries (HIPC)High incomeHondurasHong Kong SAR, ChinaHungaryIBRD onlyIcelandIDA & IBRD totalIDA blendIDA onlyIDA totalIndiaIndonesiaIran, Islamic Rep.IraqIrelandIsraelItalyJamaicaJapanJordanKazakhstanKenyaKiribatiKorea, Dem. People’s Rep.Korea, Rep.KuwaitKyrgyz RepublicLao PDRLate-demographic dividendLatin America & Caribbean Latin America & Caribbean (excluding high income)Latin America & the Caribbean (IDA & IBRD countries)LatviaLeast developed countries: UN classificationLebanonLesothoLiberiaLibyaLithuaniaLow & middle incomeLow incomeLower middle incomeLuxembourgMacao SAR, ChinaMacedonia, FYRMadagascarMalawiMalaysiaMaldivesMaliMaltaMarshall IslandsMauritaniaMauritiusMexicoMicronesia, Fed. Sts.Middle East & North AfricaMiddle East & North Africa (excluding high income)Middle East & North Africa (IDA & IBRD countries)Middle incomeMoldovaMongoliaMontenegroMoroccoMozambiqueMyanmarNamibiaNepalNetherlandsNew CaledoniaNew ZealandNicaraguaNigerNigeriaNorth AmericaNorwayOECD membersOmanOther small statesPacific island small statesPakistanPanamaPapua New GuineaParaguayPeruPhilippinesPolandPortugalPost-demographic dividendPre-demographic dividendPuerto RicoQatarRomaniaRussian FederationRwandaSamoaSao Tome and PrincipeSaudi ArabiaSenegalSerbiaSeychellesSierra LeoneSingaporeSlovak RepublicSloveniaSmall statesSolomon IslandsSomaliaSouth AfricaSouth AsiaSouth Asia (IDA & IBRD)South SudanSpainSri LankaSt. Kitts and NevisSt. LuciaSt. Vincent and the GrenadinesSub-Saharan Africa Sub-Saharan Africa (excluding high income)Sub-Saharan Africa (IDA & IBRD countries)SudanSurinameSwazilandSwedenSwitzerlandSyrian Arab RepublicTajikistanTanzaniaThailandTimor-LesteTogoTongaTrinidad and TobagoTunisiaTurkeyTurkmenistanUgandaUkraineUnited Arab EmiratesUnited KingdomUnited StatesUpper middle incomeUruguayUzbekistanVanuatuVenezuela, RBVietnamVirgin Islands (U.S.)West Bank and GazaWorldYemen, Rep.ZambiaZimbabwe Linha do tempo:
Nesta escala de tempo está apresentado um gráfico de 1961 ano até 2015 ano Mozambique. Dados de 1960 ano ausente. O número de observações reais por data: 55.
Fonte (nome):
Indicadores de desenvolvimento mundial
Fonte (organização):
(1) United Nations Population Division. World Population Prospects. New York, United Nations, Department of Economic and Social Affairs (advanced Excel tables). Available at http://esa.un.org/wpp/unpp/panel_population.htm, (2) University of California, Berkeley, and Max Planck Institute for Demographic Research. Human Mortality Database. [ www.mortality.org or www.humanmortality.de].
Categorias:
Health, Gender
Foi atualizado:
23 abr 2017 ano
Indicadores de alterações dos valores ao longo dos anos
Mínimo:
425.115
1 jan 2015 ano
Máximo:
539.145
1 jan 1961 ano
Na data de observação
Valor
Mudança absoluta
A alteração em relação ao valor anterior
1 jan 1961 ano
539.145
+539.145
0.0%
1 jan 1962 ano
533.604
-5.541
-1.03%
1 jan 1963 ano
528.063
-5.541
-1.04%
1 jan 1964 ano
523.684
-4.379
-0.83%
1 jan 1965 ano
519.304
-4.38
-0.84%
1 jan 1966 ano
514.925
-4.379
-0.84%
1 jan 1967 ano
510.546
-4.379
-0.85%
1 jan 1968 ano
506.167
-4.379
-0.86%
1 jan 1969 ano
501.162
-5.005
-0.99%
1 jan 1970 ano
496.157
-5.005
-1.0%
1 jan 1971 ano
491.152
-5.005
-1.01%
1 jan 1972 ano
486.147
-5.005
-1.02%
1 jan 1973 ano
481.142
-5.005
-1.03%
1 jan 1974 ano
476.75
-4.392
-0.91%
1 jan 1975 ano
472.357
-4.393
-0.92%
1 jan 1976 ano
467.964
-4.393
-0.93%
1 jan 1977 ano
463.571
-4.393
-0.94%
1 jan 1978 ano
459.178
-4.393
-0.95%
1 jan 1979 ano
460.812
+1.634
0.36%
1 jan 1980 ano
462.445
+1.633
0.35%
1 jan 1981 ano
464.079
+1.634
0.35%
1 jan 1982 ano
465.712
+1.633
0.35%
1 jan 1983 ano
467.346
+1.634
0.35%
1 jan 1984 ano
465.175
-2.171
-0.46%
1 jan 1985 ano
463.005
-2.17
-0.47%
1 jan 1986 ano
460.834
-2.171
-0.47%
1 jan 1987 ano
458.664
-2.17
-0.47%
1 jan 1988 ano
456.493
-2.171
-0.47%
1 jan 1989 ano
453.821
-2.672
-0.59%
1 jan 1990 ano
451.148
-2.673
-0.59%
1 jan 1991 ano
448.476
-2.672
-0.59%
1 jan 1992 ano
445.803
-2.673
-0.6%
1 jan 1993 ano
443.131
-2.672
-0.6%
1 jan 1994 ano
441.944
-1.187
-0.27%
1 jan 1995 ano
440.758
-1.186
-0.27%
1 jan 1996 ano
439.572
-1.186
-0.27%
1 jan 1997 ano
438.385
-1.187
-0.27%
1 jan 1998 ano
437.199
-1.186
-0.27%
1 jan 1999 ano
443.574
+6.375
1.46%
1 jan 2000 ano
449.949
+6.375
1.44%
1 jan 2001 ano
456.323
+6.374
1.42%
1 jan 2002 ano
462.698
+6.375
1.4%
1 jan 2003 ano
469.073
+6.375
1.38%
1 jan 2004 ano
467.688
-1.385
-0.3%
1 jan 2005 ano
466.304
-1.384
-0.3%
1 jan 2006 ano
464.92
-1.384
-0.3%
1 jan 2007 ano
463.535
-1.385
-0.3%
1 jan 2008 ano
462.151
-1.384
-0.3%
1 jan 2009 ano
456.34
-5.811
-1.26%
1 jan 2010 ano
450.528
-5.812
-1.27%
1 jan 2011 ano
444.717
-5.811
-1.29%
1 jan 2012 ano
438.905
-5.812
-1.31%
1 jan 2013 ano
433.094
-5.811
-1.32%
1 jan 2014 ano
429.104
-3.99
-0.92%
1 jan 2015 ano
425.115
-3.989
-0.93%
Classificação de países por estatísticas atuais por anos


Comentários: