29
/pt/
pt
AIzaSyAYiBZKx7MnpbEhh9jyipgxe19OcubqV5w
April 1, 2024
241879
Slovak Republic
SVK
true
2
1
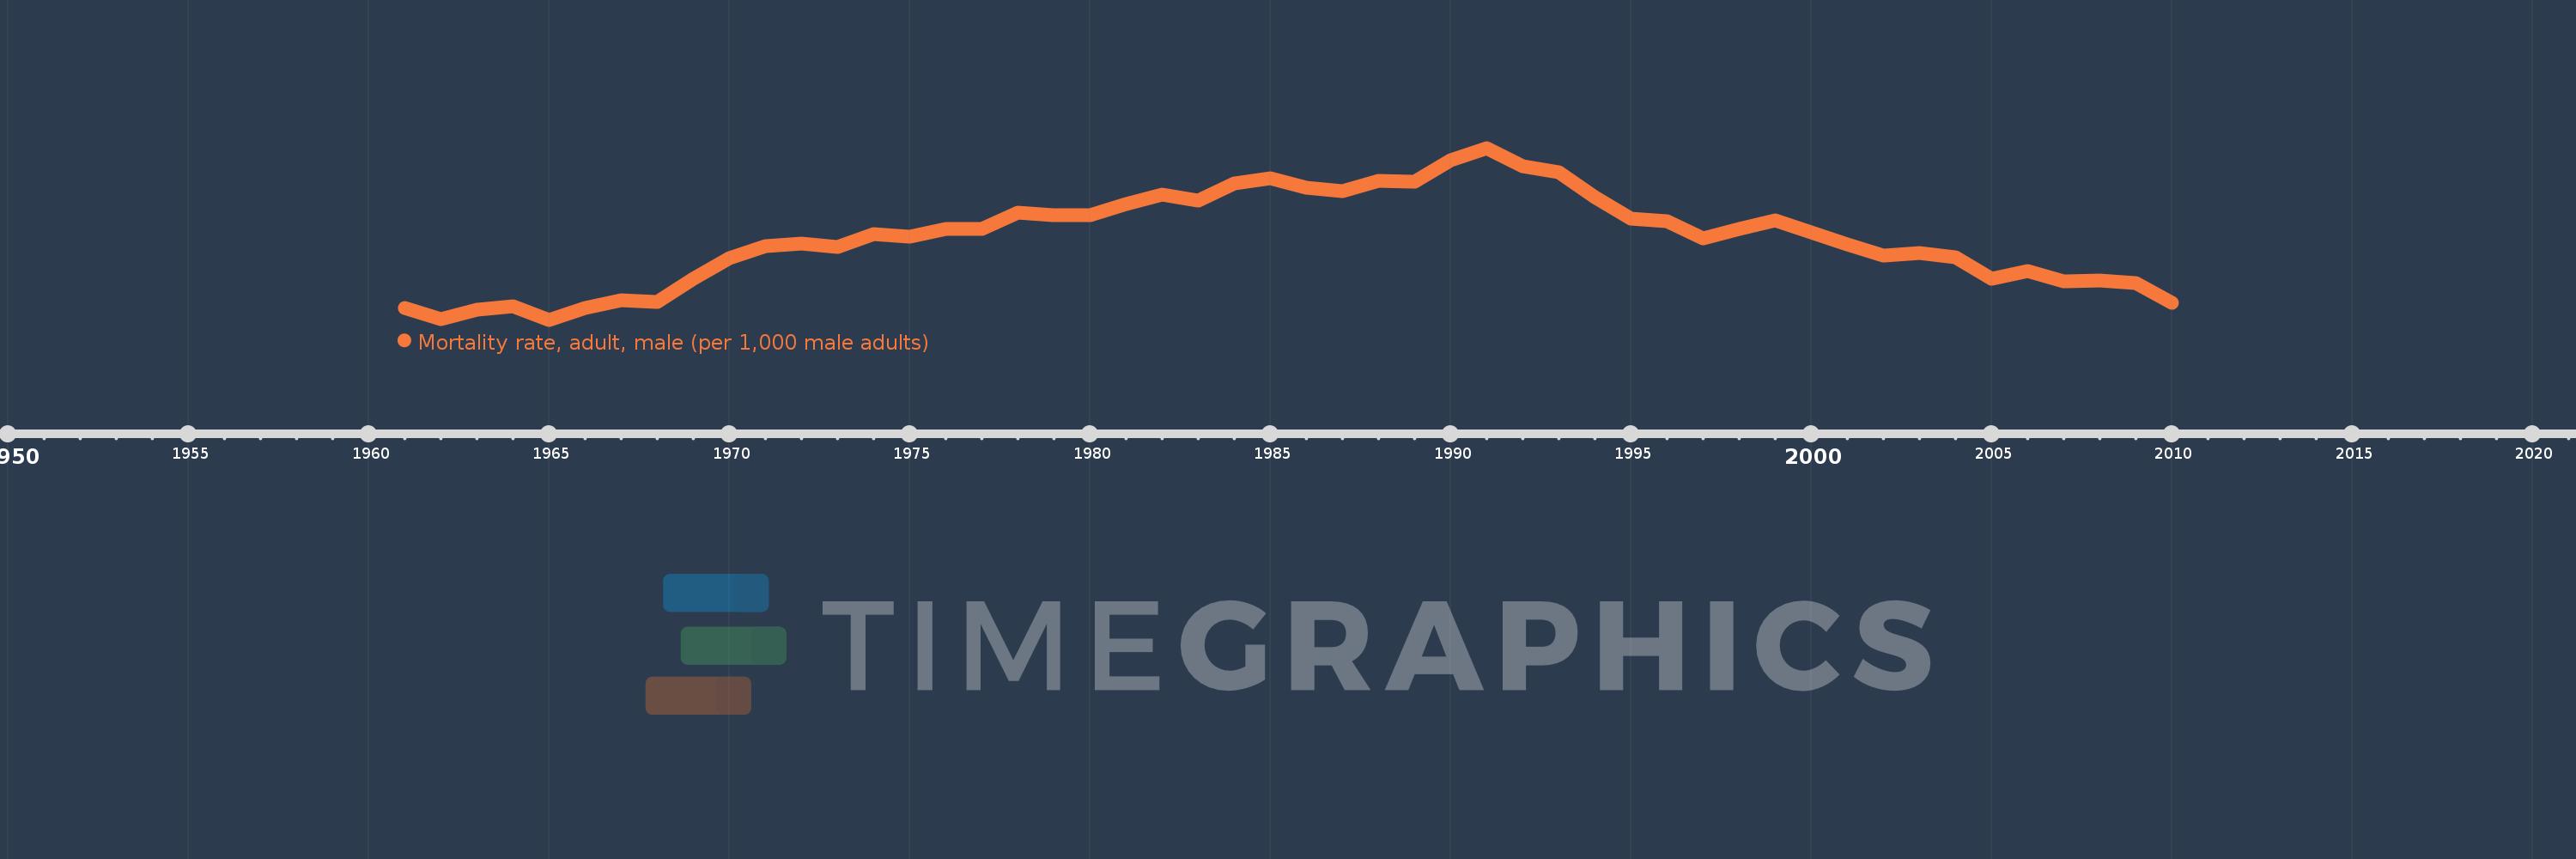
Mortality rate, adult, male (per 1,000 male adults)
2010,2009,2008,2007,2006,2005,2004,2003,2002,2001,2000,1999,1998,1997,1996,1995,1994,1993,1992,1991,1990,1989,1988,1987,1986,1985,1984,1983,1982,1981,1980,1979,1978,1977,1976,1975,1974,1973,1972,1971,1970,1969,1968,1967,1966,1965,1964,1963,1962,1961
Estas estatísticas em outros países:
AfghanistanAlbaniaAlgeriaAngolaAntigua and BarbudaArab WorldArgentinaArmeniaArubaAustraliaAustriaAzerbaijanBahamas, TheBahrainBangladeshBarbadosBelarusBelgiumBelizeBeninBhutanBoliviaBosnia and HerzegovinaBotswanaBrazilBrunei DarussalamBulgariaBurkina FasoBurundiCabo VerdeCambodiaCameroonCanadaCaribbean small statesCentral African RepublicCentral Europe and the BalticsChadChannel IslandsChileChinaColombiaComorosCongo, Dem. Rep.Congo, Rep.Costa RicaCote d'IvoireCroatiaCubaCuracaoCyprusCzech RepublicDenmarkDjiboutiDominicaDominican RepublicEarly-demographic dividendEast Asia & PacificEast Asia & Pacific (excluding high income)East Asia & Pacific (IDA & IBRD countries)EcuadorEgypt, Arab Rep.El SalvadorEquatorial GuineaEritreaEstoniaEthiopiaEuro areaEurope & Central AsiaEurope & Central Asia (excluding high income)Europe & Central Asia (IDA & IBRD countries)European UnionFijiFinlandFragile and conflict affected situationsFranceFrench PolynesiaGabonGambia, TheGeorgiaGermanyGhanaGreeceGreenlandGrenadaGuamGuatemalaGuineaGuinea-BissauGuyanaHaitiHeavily indebted poor countries (HIPC)High incomeHondurasHong Kong SAR, ChinaHungaryIBRD onlyIcelandIDA & IBRD totalIDA blendIDA onlyIDA totalIndiaIndonesiaIran, Islamic Rep.IraqIrelandIsraelItalyJamaicaJapanJordanKazakhstanKenyaKiribatiKorea, Dem. People’s Rep.Korea, Rep.KuwaitKyrgyz RepublicLao PDRLate-demographic dividendLatin America & Caribbean Latin America & Caribbean (excluding high income)Latin America & the Caribbean (IDA & IBRD countries)LatviaLeast developed countries: UN classificationLebanonLesothoLiberiaLibyaLithuaniaLow & middle incomeLow incomeLower middle incomeLuxembourgMacao SAR, ChinaMacedonia, FYRMadagascarMalawiMalaysiaMaldivesMaliMaltaMarshall IslandsMauritaniaMauritiusMexicoMicronesia, Fed. Sts.Middle East & North AfricaMiddle East & North Africa (excluding high income)Middle East & North Africa (IDA & IBRD countries)Middle incomeMoldovaMongoliaMontenegroMoroccoMozambiqueMyanmarNamibiaNepalNetherlandsNew CaledoniaNew ZealandNicaraguaNigerNigeriaNorth AmericaNorwayOECD membersOmanOther small statesPacific island small statesPakistanPanamaPapua New GuineaParaguayPeruPhilippinesPolandPortugalPost-demographic dividendPre-demographic dividendPuerto RicoQatarRomaniaRussian FederationRwandaSamoaSao Tome and PrincipeSaudi ArabiaSenegalSerbiaSeychellesSierra LeoneSingaporeSlovak RepublicSloveniaSmall statesSolomon IslandsSomaliaSouth AfricaSouth AsiaSouth Asia (IDA & IBRD)South SudanSpainSri LankaSt. Kitts and NevisSt. LuciaSt. Vincent and the GrenadinesSub-Saharan Africa Sub-Saharan Africa (excluding high income)Sub-Saharan Africa (IDA & IBRD countries)SudanSurinameSwazilandSwedenSwitzerlandSyrian Arab RepublicTajikistanTanzaniaThailandTimor-LesteTogoTongaTrinidad and TobagoTunisiaTurkeyTurkmenistanUgandaUkraineUnited Arab EmiratesUnited KingdomUnited StatesUpper middle incomeUruguayUzbekistanVanuatuVenezuela, RBVietnamVirgin Islands (U.S.)West Bank and GazaWorldYemen, Rep.ZambiaZimbabwe Linha do tempo:
Nesta escala de tempo está apresentado um gráfico de 1961 ano até 2010 ano Slovak Republic. Dados de 1960 ano ausente. O número de observações reais por data: 50.
Fonte (nome):
Indicadores de desenvolvimento mundial
Fonte (organização):
(1) United Nations Population Division. World Population Prospects. New York, United Nations, Department of Economic and Social Affairs (advanced Excel tables). Available at http://esa.un.org/wpp/unpp/panel_population.htm, (2) University of California, Berkeley, and Max Planck Institute for Demographic Research. Human Mortality Database. [ www.mortality.org or www.humanmortality.de].
Categorias:
Health, Gender
Foi atualizado:
23 abr 2017 ano
Indicadores de alterações dos valores ao longo dos anos
Mínimo:
174.721
1 jan 1965 ano
Máximo:
270.649
1 jan 1991 ano
Na data de observação
Valor
Mudança absoluta
A alteração em relação ao valor anterior
1 jan 1961 ano
181.272
+181.272
0.0%
1 jan 1962 ano
175.091
-6.181
-3.41%
1 jan 1963 ano
180.219
+5.128
2.93%
1 jan 1964 ano
182.485
+2.266
1.26%
1 jan 1965 ano
174.721
-7.764
-4.25%
1 jan 1966 ano
181.435
+6.714
3.84%
1 jan 1967 ano
185.796
+4.361
2.4%
1 jan 1968 ano
184.773
-1.023
-0.55%
1 jan 1969 ano
197.396
+12.623
6.83%
1 jan 1970 ano
209.216
+11.82
5.99%
1 jan 1971 ano
215.683
+6.467
3.09%
1 jan 1972 ano
217.364
+1.681
0.78%
1 jan 1973 ano
215.351
-2.013
-0.93%
1 jan 1974 ano
222.668
+7.317
3.4%
1 jan 1975 ano
221.053
-1.615
-0.73%
1 jan 1976 ano
225.366
+4.313
1.95%
1 jan 1977 ano
225.347
-0.019
-0.01%
1 jan 1978 ano
234.342
+8.995
3.99%
1 jan 1979 ano
233.198
-1.144
-0.49%
1 jan 1980 ano
233.148
-0.05
-0.02%
1 jan 1981 ano
239.178
+6.03
2.59%
1 jan 1982 ano
244.444
+5.266
2.2%
1 jan 1983 ano
241.244
-3.2
-1.31%
1 jan 1984 ano
251.019
+9.775
4.05%
1 jan 1985 ano
253.825
+2.806
1.12%
1 jan 1986 ano
248.531
-5.294
-2.09%
1 jan 1987 ano
246.644
-1.887
-0.76%
1 jan 1988 ano
252.511
+5.867
2.38%
1 jan 1989 ano
251.66
-0.851
-0.34%
1 jan 1990 ano
263.808
+12.148
4.83%
1 jan 1991 ano
270.649
+6.841
2.59%
1 jan 1992 ano
260.558
-10.091
-3.73%
1 jan 1993 ano
256.844
-3.714
-1.43%
1 jan 1994 ano
243.329
-13.515
-5.26%
1 jan 1995 ano
231.344
-11.985
-4.93%
1 jan 1996 ano
229.544
-1.8
-0.78%
1 jan 1997 ano
220.315
-9.229
-4.02%
1 jan 1998 ano
225.37
+5.055
2.29%
1 jan 1999 ano
230.194
+4.824
2.14%
1 jan 2000 ano
223.535
-6.659
-2.89%
1 jan 2001 ano
216.584
-6.951
-3.11%
1 jan 2002 ano
210.745
-5.839
-2.7%
1 jan 2003 ano
212.138
+1.393
0.66%
1 jan 2004 ano
209.444
-2.694
-1.27%
1 jan 2005 ano
197.771
-11.673
-5.57%
1 jan 2006 ano
201.777
+4.006
2.03%
1 jan 2007 ano
196.393
-5.384
-2.67%
1 jan 2008 ano
196.844
+0.451
0.23%
1 jan 2009 ano
195.393
-1.451
-0.74%
1 jan 2010 ano
184.241
-11.152
-5.71%
Classificação de países por estatísticas atuais por anos


Comentários: