29
/pt/
pt
AIzaSyAYiBZKx7MnpbEhh9jyipgxe19OcubqV5w
April 1, 2024
127576
Equatorial Guinea
GNQ
true
2
1
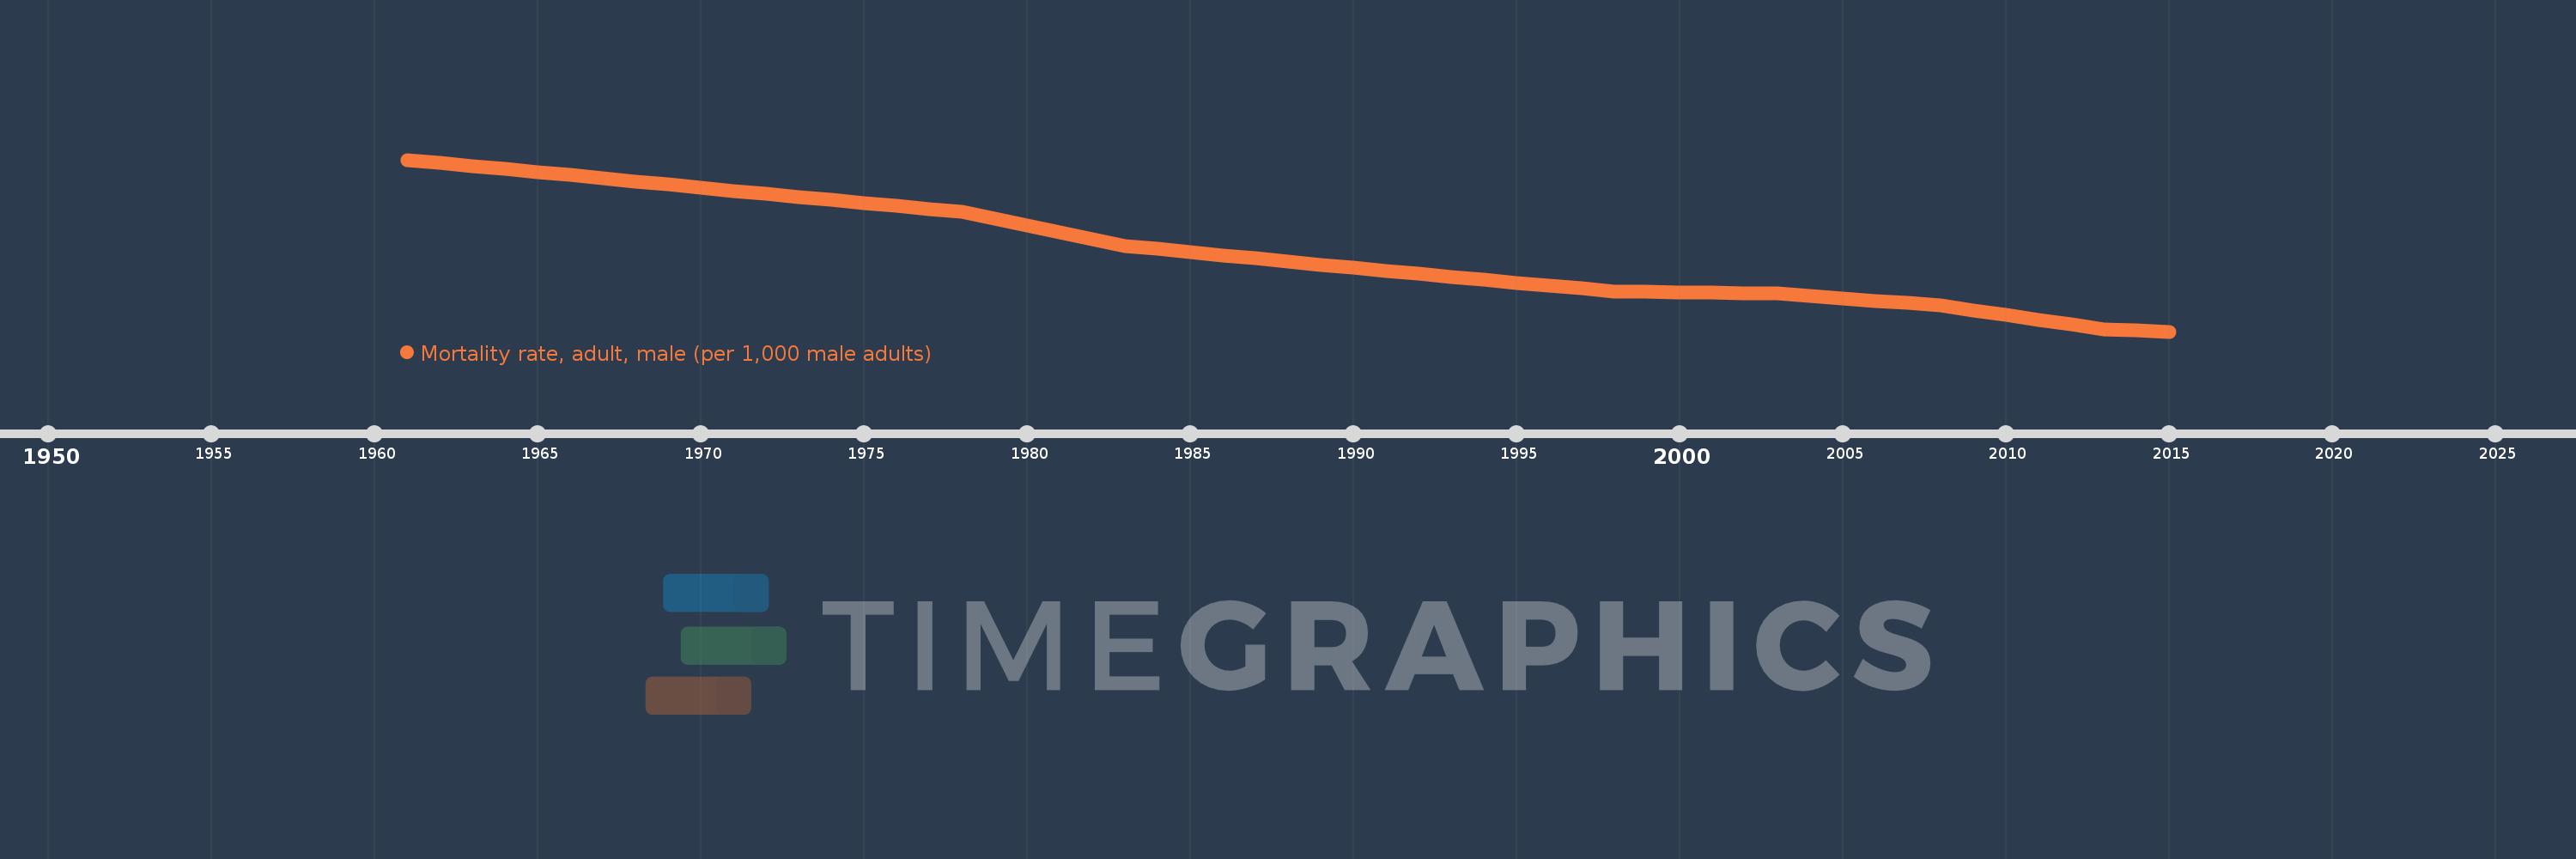
Mortality rate, adult, male (per 1,000 male adults)
2015,2014,2013,2012,2011,2010,2009,2008,2007,2006,2005,2004,2003,2002,2001,2000,1999,1998,1997,1996,1995,1994,1993,1992,1991,1990,1989,1988,1987,1986,1985,1984,1983,1982,1981,1980,1979,1978,1977,1976,1975,1974,1973,1972,1971,1970,1969,1968,1967,1966,1965,1964,1963,1962,1961
Estas estatísticas em outros países:
AfghanistanAlbaniaAlgeriaAngolaAntigua and BarbudaArab WorldArgentinaArmeniaArubaAustraliaAustriaAzerbaijanBahamas, TheBahrainBangladeshBarbadosBelarusBelgiumBelizeBeninBhutanBoliviaBosnia and HerzegovinaBotswanaBrazilBrunei DarussalamBulgariaBurkina FasoBurundiCabo VerdeCambodiaCameroonCanadaCaribbean small statesCentral African RepublicCentral Europe and the BalticsChadChannel IslandsChileChinaColombiaComorosCongo, Dem. Rep.Congo, Rep.Costa RicaCote d'IvoireCroatiaCubaCuracaoCyprusCzech RepublicDenmarkDjiboutiDominicaDominican RepublicEarly-demographic dividendEast Asia & PacificEast Asia & Pacific (excluding high income)East Asia & Pacific (IDA & IBRD countries)EcuadorEgypt, Arab Rep.El SalvadorEquatorial GuineaEritreaEstoniaEthiopiaEuro areaEurope & Central AsiaEurope & Central Asia (excluding high income)Europe & Central Asia (IDA & IBRD countries)European UnionFijiFinlandFragile and conflict affected situationsFranceFrench PolynesiaGabonGambia, TheGeorgiaGermanyGhanaGreeceGreenlandGrenadaGuamGuatemalaGuineaGuinea-BissauGuyanaHaitiHeavily indebted poor countries (HIPC)High incomeHondurasHong Kong SAR, ChinaHungaryIBRD onlyIcelandIDA & IBRD totalIDA blendIDA onlyIDA totalIndiaIndonesiaIran, Islamic Rep.IraqIrelandIsraelItalyJamaicaJapanJordanKazakhstanKenyaKiribatiKorea, Dem. People’s Rep.Korea, Rep.KuwaitKyrgyz RepublicLao PDRLate-demographic dividendLatin America & Caribbean Latin America & Caribbean (excluding high income)Latin America & the Caribbean (IDA & IBRD countries)LatviaLeast developed countries: UN classificationLebanonLesothoLiberiaLibyaLithuaniaLow & middle incomeLow incomeLower middle incomeLuxembourgMacao SAR, ChinaMacedonia, FYRMadagascarMalawiMalaysiaMaldivesMaliMaltaMarshall IslandsMauritaniaMauritiusMexicoMicronesia, Fed. Sts.Middle East & North AfricaMiddle East & North Africa (excluding high income)Middle East & North Africa (IDA & IBRD countries)Middle incomeMoldovaMongoliaMontenegroMoroccoMozambiqueMyanmarNamibiaNepalNetherlandsNew CaledoniaNew ZealandNicaraguaNigerNigeriaNorth AmericaNorwayOECD membersOmanOther small statesPacific island small statesPakistanPanamaPapua New GuineaParaguayPeruPhilippinesPolandPortugalPost-demographic dividendPre-demographic dividendPuerto RicoQatarRomaniaRussian FederationRwandaSamoaSao Tome and PrincipeSaudi ArabiaSenegalSerbiaSeychellesSierra LeoneSingaporeSlovak RepublicSloveniaSmall statesSolomon IslandsSomaliaSouth AfricaSouth AsiaSouth Asia (IDA & IBRD)South SudanSpainSri LankaSt. Kitts and NevisSt. LuciaSt. Vincent and the GrenadinesSub-Saharan Africa Sub-Saharan Africa (excluding high income)Sub-Saharan Africa (IDA & IBRD countries)SudanSurinameSwazilandSwedenSwitzerlandSyrian Arab RepublicTajikistanTanzaniaThailandTimor-LesteTogoTongaTrinidad and TobagoTunisiaTurkeyTurkmenistanUgandaUkraineUnited Arab EmiratesUnited KingdomUnited StatesUpper middle incomeUruguayUzbekistanVanuatuVenezuela, RBVietnamVirgin Islands (U.S.)West Bank and GazaWorldYemen, Rep.ZambiaZimbabwe Linha do tempo:
Nesta escala de tempo está apresentado um gráfico de 1961 ano até 2015 ano Equatorial Guinea. Dados de 1960 ano ausente. O número de observações reais por data: 55.
Fonte (nome):
Indicadores de desenvolvimento mundial
Fonte (organização):
(1) United Nations Population Division. World Population Prospects. New York, United Nations, Department of Economic and Social Affairs (advanced Excel tables). Available at http://esa.un.org/wpp/unpp/panel_population.htm, (2) University of California, Berkeley, and Max Planck Institute for Demographic Research. Human Mortality Database. [ www.mortality.org or www.humanmortality.de].
Categorias:
Health, Gender
Foi atualizado:
23 abr 2017 ano
Indicadores de alterações dos valores ao longo dos anos
Mínimo:
325.925
1 jan 2015 ano
Máximo:
520.91
1 jan 1961 ano
Na data de observação
Valor
Mudança absoluta
A alteração em relação ao valor anterior
1 jan 1961 ano
520.91
+520.91
0.0%
1 jan 1962 ano
517.369
-3.541
-0.68%
1 jan 1963 ano
513.828
-3.541
-0.68%
1 jan 1964 ano
510.348
-3.48
-0.68%
1 jan 1965 ano
506.868
-3.48
-0.68%
1 jan 1966 ano
503.389
-3.479
-0.69%
1 jan 1967 ano
499.909
-3.48
-0.69%
1 jan 1968 ano
496.429
-3.48
-0.7%
1 jan 1969 ano
492.88
-3.549
-0.71%
1 jan 1970 ano
489.332
-3.548
-0.72%
1 jan 1971 ano
485.783
-3.549
-0.73%
1 jan 1972 ano
482.234
-3.549
-0.73%
1 jan 1973 ano
478.685
-3.549
-0.74%
1 jan 1974 ano
475.255
-3.43
-0.72%
1 jan 1975 ano
471.825
-3.43
-0.72%
1 jan 1976 ano
468.395
-3.43
-0.73%
1 jan 1977 ano
464.965
-3.43
-0.73%
1 jan 1978 ano
461.535
-3.43
-0.74%
1 jan 1979 ano
453.835
-7.7
-1.67%
1 jan 1980 ano
446.135
-7.7
-1.7%
1 jan 1981 ano
438.435
-7.7
-1.73%
1 jan 1982 ano
430.735
-7.7
-1.76%
1 jan 1983 ano
423.035
-7.7
-1.79%
1 jan 1984 ano
419.528
-3.507
-0.83%
1 jan 1985 ano
416.021
-3.507
-0.84%
1 jan 1986 ano
412.515
-3.506
-0.84%
1 jan 1987 ano
409.008
-3.507
-0.85%
1 jan 1988 ano
405.501
-3.507
-0.86%
1 jan 1989 ano
401.948
-3.553
-0.88%
1 jan 1990 ano
398.395
-3.553
-0.88%
1 jan 1991 ano
394.842
-3.553
-0.89%
1 jan 1992 ano
391.289
-3.553
-0.9%
1 jan 1993 ano
387.736
-3.553
-0.91%
1 jan 1994 ano
384.521
-3.215
-0.83%
1 jan 1995 ano
381.305
-3.216
-0.84%
1 jan 1996 ano
378.089
-3.216
-0.84%
1 jan 1997 ano
374.874
-3.215
-0.85%
1 jan 1998 ano
371.658
-3.216
-0.86%
1 jan 1999 ano
371.1
-0.558
-0.15%
1 jan 2000 ano
370.542
-0.558
-0.15%
1 jan 2001 ano
369.984
-0.558
-0.15%
1 jan 2002 ano
369.426
-0.558
-0.15%
1 jan 2003 ano
368.868
-0.558
-0.15%
1 jan 2004 ano
366.221
-2.647
-0.72%
1 jan 2005 ano
363.574
-2.647
-0.72%
1 jan 2006 ano
360.927
-2.647
-0.73%
1 jan 2007 ano
358.28
-2.647
-0.73%
1 jan 2008 ano
355.633
-2.647
-0.74%
1 jan 2009 ano
350.275
-5.358
-1.51%
1 jan 2010 ano
344.916
-5.359
-1.53%
1 jan 2011 ano
339.558
-5.358
-1.55%
1 jan 2012 ano
334.2
-5.358
-1.58%
1 jan 2013 ano
328.841
-5.359
-1.6%
1 jan 2014 ano
327.383
-1.458
-0.44%
1 jan 2015 ano
325.925
-1.458
-0.45%
Classificação de países por estatísticas atuais por anos


Comentários: