29
/pt/
pt
AIzaSyAYiBZKx7MnpbEhh9jyipgxe19OcubqV5w
April 1, 2024
209578
New Zealand
NZL
true
2
1
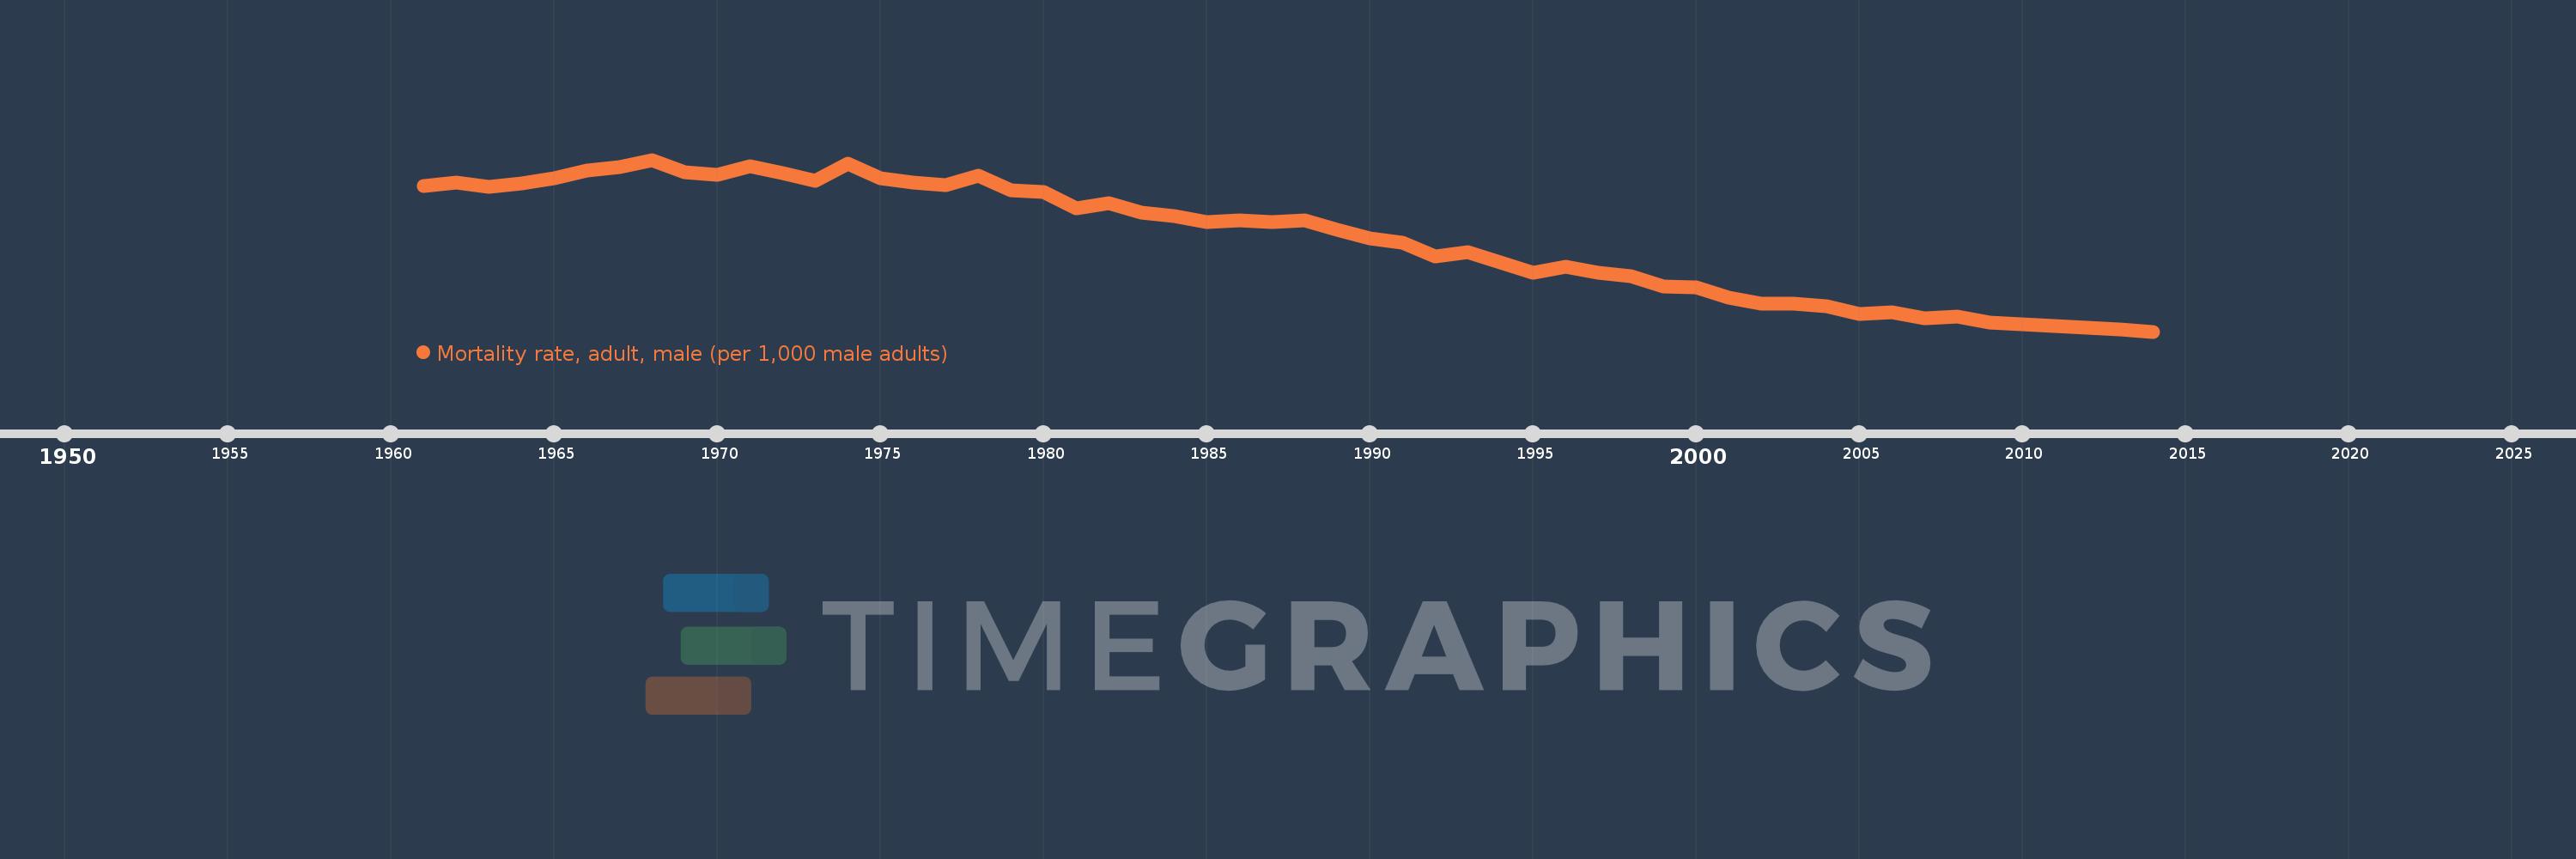
Mortality rate, adult, male (per 1,000 male adults)
2014,2013,2012,2011,2010,2009,2008,2007,2006,2005,2004,2003,2002,2001,2000,1999,1998,1997,1996,1995,1994,1993,1992,1991,1990,1989,1988,1987,1986,1985,1984,1983,1982,1981,1980,1979,1978,1977,1976,1975,1974,1973,1972,1971,1970,1969,1968,1967,1966,1965,1964,1963,1962,1961
Estas estatísticas em outros países:
AfghanistanAlbaniaAlgeriaAngolaAntigua and BarbudaArab WorldArgentinaArmeniaArubaAustraliaAustriaAzerbaijanBahamas, TheBahrainBangladeshBarbadosBelarusBelgiumBelizeBeninBhutanBoliviaBosnia and HerzegovinaBotswanaBrazilBrunei DarussalamBulgariaBurkina FasoBurundiCabo VerdeCambodiaCameroonCanadaCaribbean small statesCentral African RepublicCentral Europe and the BalticsChadChannel IslandsChileChinaColombiaComorosCongo, Dem. Rep.Congo, Rep.Costa RicaCote d'IvoireCroatiaCubaCuracaoCyprusCzech RepublicDenmarkDjiboutiDominicaDominican RepublicEarly-demographic dividendEast Asia & PacificEast Asia & Pacific (excluding high income)East Asia & Pacific (IDA & IBRD countries)EcuadorEgypt, Arab Rep.El SalvadorEquatorial GuineaEritreaEstoniaEthiopiaEuro areaEurope & Central AsiaEurope & Central Asia (excluding high income)Europe & Central Asia (IDA & IBRD countries)European UnionFijiFinlandFragile and conflict affected situationsFranceFrench PolynesiaGabonGambia, TheGeorgiaGermanyGhanaGreeceGreenlandGrenadaGuamGuatemalaGuineaGuinea-BissauGuyanaHaitiHeavily indebted poor countries (HIPC)High incomeHondurasHong Kong SAR, ChinaHungaryIBRD onlyIcelandIDA & IBRD totalIDA blendIDA onlyIDA totalIndiaIndonesiaIran, Islamic Rep.IraqIrelandIsraelItalyJamaicaJapanJordanKazakhstanKenyaKiribatiKorea, Dem. People’s Rep.Korea, Rep.KuwaitKyrgyz RepublicLao PDRLate-demographic dividendLatin America & Caribbean Latin America & Caribbean (excluding high income)Latin America & the Caribbean (IDA & IBRD countries)LatviaLeast developed countries: UN classificationLebanonLesothoLiberiaLibyaLithuaniaLow & middle incomeLow incomeLower middle incomeLuxembourgMacao SAR, ChinaMacedonia, FYRMadagascarMalawiMalaysiaMaldivesMaliMaltaMarshall IslandsMauritaniaMauritiusMexicoMicronesia, Fed. Sts.Middle East & North AfricaMiddle East & North Africa (excluding high income)Middle East & North Africa (IDA & IBRD countries)Middle incomeMoldovaMongoliaMontenegroMoroccoMozambiqueMyanmarNamibiaNepalNetherlandsNew CaledoniaNew ZealandNicaraguaNigerNigeriaNorth AmericaNorwayOECD membersOmanOther small statesPacific island small statesPakistanPanamaPapua New GuineaParaguayPeruPhilippinesPolandPortugalPost-demographic dividendPre-demographic dividendPuerto RicoQatarRomaniaRussian FederationRwandaSamoaSao Tome and PrincipeSaudi ArabiaSenegalSerbiaSeychellesSierra LeoneSingaporeSlovak RepublicSloveniaSmall statesSolomon IslandsSomaliaSouth AfricaSouth AsiaSouth Asia (IDA & IBRD)South SudanSpainSri LankaSt. Kitts and NevisSt. LuciaSt. Vincent and the GrenadinesSub-Saharan Africa Sub-Saharan Africa (excluding high income)Sub-Saharan Africa (IDA & IBRD countries)SudanSurinameSwazilandSwedenSwitzerlandSyrian Arab RepublicTajikistanTanzaniaThailandTimor-LesteTogoTongaTrinidad and TobagoTunisiaTurkeyTurkmenistanUgandaUkraineUnited Arab EmiratesUnited KingdomUnited StatesUpper middle incomeUruguayUzbekistanVanuatuVenezuela, RBVietnamVirgin Islands (U.S.)West Bank and GazaWorldYemen, Rep.ZambiaZimbabwe Linha do tempo:
Nesta escala de tempo está apresentado um gráfico de 1961 ano até 2014 ano New Zealand. Dados de 1960 ano ausente. O número de observações reais por data: 54.
Fonte (nome):
Indicadores de desenvolvimento mundial
Fonte (organização):
(1) United Nations Population Division. World Population Prospects. New York, United Nations, Department of Economic and Social Affairs (advanced Excel tables). Available at http://esa.un.org/wpp/unpp/panel_population.htm, (2) University of California, Berkeley, and Max Planck Institute for Demographic Research. Human Mortality Database. [ www.mortality.org or www.humanmortality.de].
Categorias:
Health, Gender
Foi atualizado:
23 abr 2017 ano
Indicadores de alterações dos valores ao longo dos anos
Mínimo:
80.71
1 jan 2014 ano
Máximo:
201.303
1 jan 1968 ano
Na data de observação
Valor
Mudança absoluta
A alteração em relação ao valor anterior
1 jan 1961 ano
182.74
+182.74
0.0%
1 jan 1962 ano
185.466
+2.726
1.49%
1 jan 1963 ano
182.411
-3.055
-1.65%
1 jan 1964 ano
184.966
+2.555
1.4%
1 jan 1965 ano
188.581
+3.615
1.95%
1 jan 1966 ano
193.731
+5.15
2.73%
1 jan 1967 ano
195.964
+2.233
1.15%
1 jan 1968 ano
201.303
+5.339
2.72%
1 jan 1969 ano
192.326
-8.977
-4.46%
1 jan 1970 ano
190.984
-1.342
-0.7%
1 jan 1971 ano
196.797
+5.813
3.04%
1 jan 1972 ano
192.057
-4.74
-2.41%
1 jan 1973 ano
186.28
-5.777
-3.01%
1 jan 1974 ano
198.373
+12.093
6.49%
1 jan 1975 ano
188.544
-9.829
-4.95%
1 jan 1976 ano
185.365
-3.179
-1.69%
1 jan 1977 ano
183.609
-1.756
-0.95%
1 jan 1978 ano
190.336
+6.727
3.66%
1 jan 1979 ano
180.017
-10.319
-5.42%
1 jan 1980 ano
178.485
-1.532
-0.85%
1 jan 1981 ano
167.265
-11.22
-6.29%
1 jan 1982 ano
170.962
+3.697
2.21%
1 jan 1983 ano
164.313
-6.649
-3.89%
1 jan 1984 ano
161.799
-2.514
-1.53%
1 jan 1985 ano
157.402
-4.397
-2.72%
1 jan 1986 ano
159.0
+1.598
1.02%
1 jan 1987 ano
157.768
-1.232
-0.77%
1 jan 1988 ano
158.576
+0.808
0.51%
1 jan 1989 ano
152.326
-6.25
-3.94%
1 jan 1990 ano
146.367
-5.959
-3.91%
1 jan 1991 ano
142.867
-3.5
-2.39%
1 jan 1992 ano
133.528
-9.339
-6.54%
1 jan 1993 ano
136.326
+2.798
2.1%
1 jan 1994 ano
129.528
-6.798
-4.99%
1 jan 1995 ano
121.735
-7.793
-6.02%
1 jan 1996 ano
125.977
+4.242
3.48%
1 jan 1997 ano
122.13
-3.847
-3.05%
1 jan 1998 ano
119.536
-2.594
-2.12%
1 jan 1999 ano
112.08
-7.456
-6.24%
1 jan 2000 ano
111.769
-0.311
-0.28%
1 jan 2001 ano
104.264
-7.505
-6.71%
1 jan 2002 ano
100.016
-4.248
-4.07%
1 jan 2003 ano
100.352
+0.336
0.34%
1 jan 2004 ano
98.537
-1.815
-1.81%
1 jan 2005 ano
93.103
-5.434
-5.51%
1 jan 2006 ano
94.329
+1.226
1.32%
1 jan 2007 ano
90.036
-4.293
-4.55%
1 jan 2008 ano
91.324
+1.288
1.43%
1 jan 2009 ano
87.306
-4.018
-4.4%
1 jan 2010 ano
85.987
-1.319
-1.51%
1 jan 2011 ano
84.668
-1.319
-1.53%
1 jan 2012 ano
83.349
-1.319
-1.56%
1 jan 2013 ano
82.03
-1.319
-1.58%
1 jan 2014 ano
80.71
-1.32
-1.61%
Classificação de países por estatísticas atuais por anos


Comentários: