29
/pt/
pt
AIzaSyAYiBZKx7MnpbEhh9jyipgxe19OcubqV5w
April 1, 2024
200668
Montenegro
MNE
true
2
1
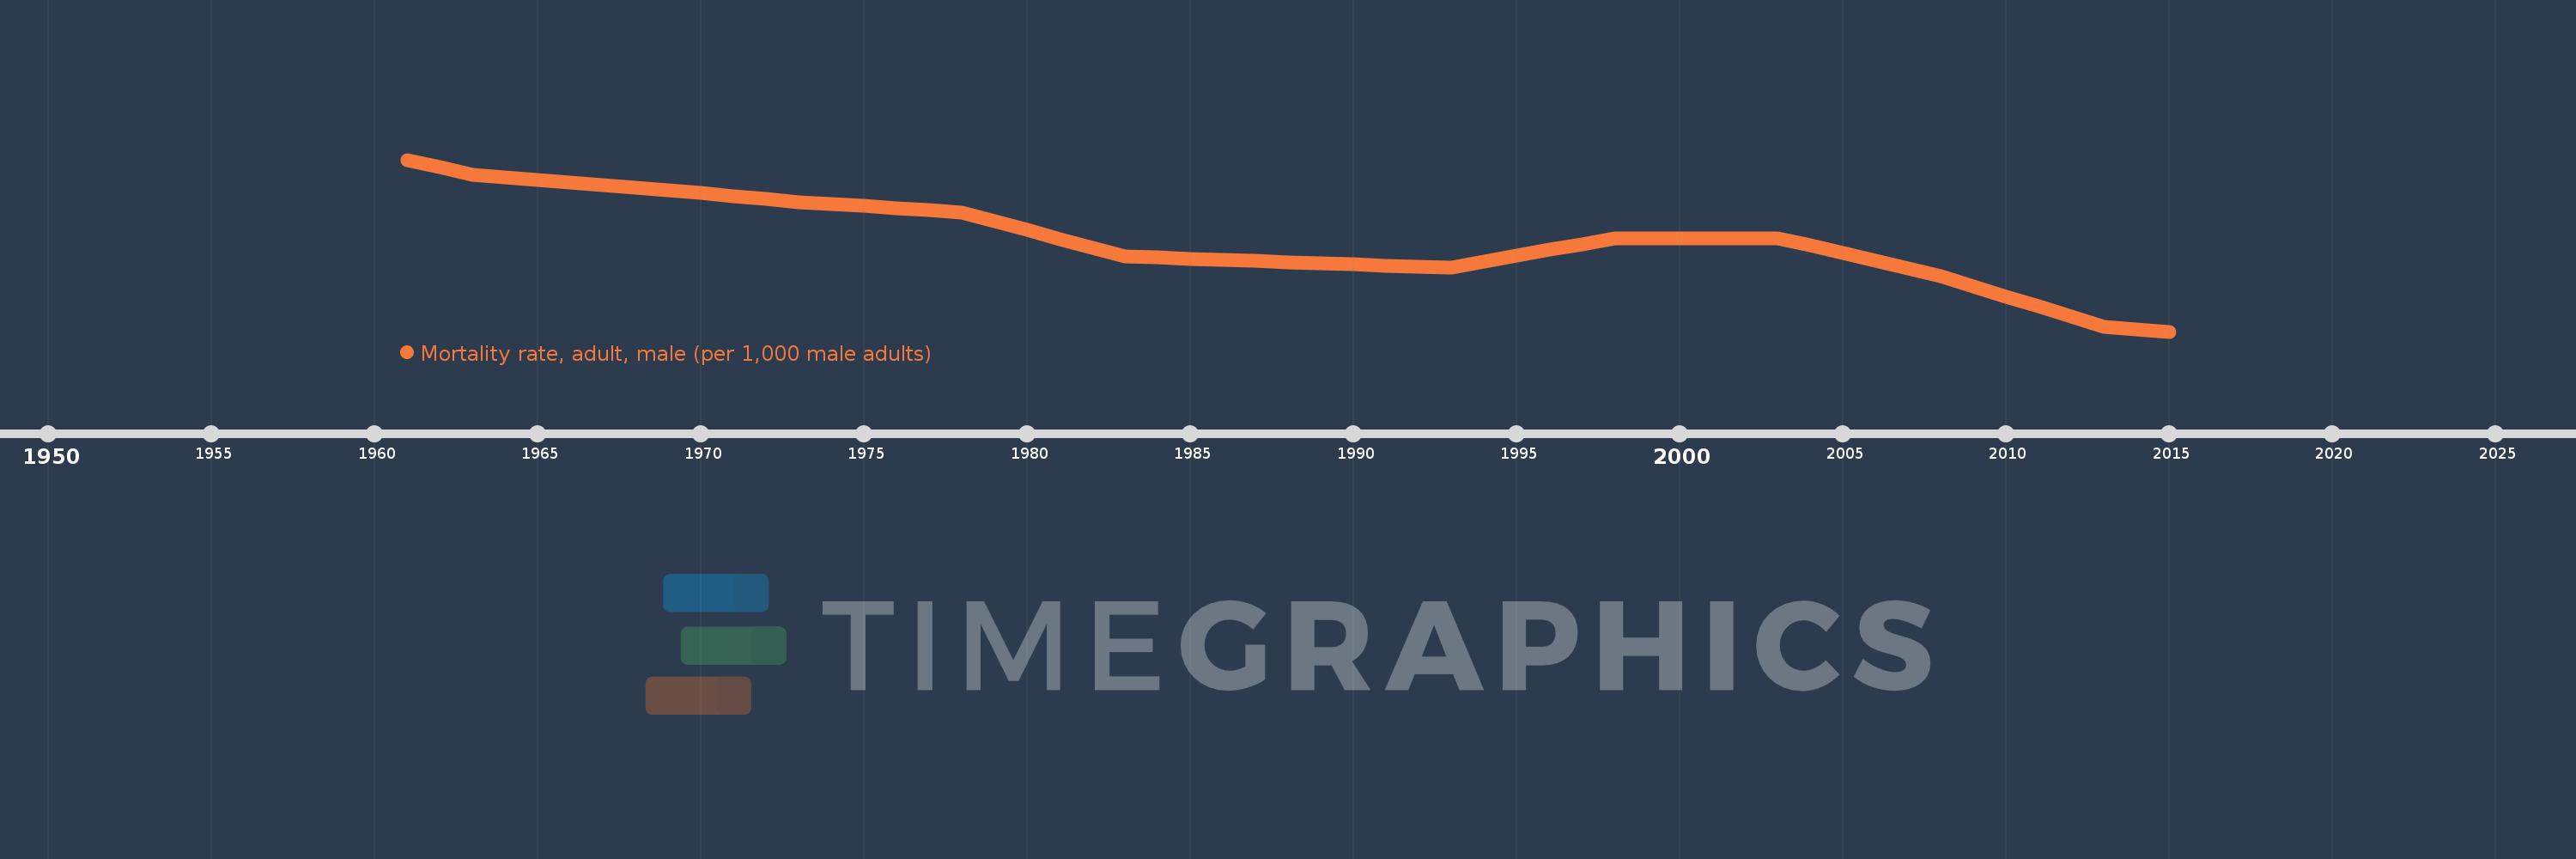
Mortality rate, adult, male (per 1,000 male adults)
2015,2014,2013,2012,2011,2010,2009,2008,2007,2006,2005,2004,2003,2002,2001,2000,1999,1998,1997,1996,1995,1994,1993,1992,1991,1990,1989,1988,1987,1986,1985,1984,1983,1982,1981,1980,1979,1978,1977,1976,1975,1974,1973,1972,1971,1970,1969,1968,1967,1966,1965,1964,1963,1962,1961
Estas estatísticas em outros países:
AfghanistanAlbaniaAlgeriaAngolaAntigua and BarbudaArab WorldArgentinaArmeniaArubaAustraliaAustriaAzerbaijanBahamas, TheBahrainBangladeshBarbadosBelarusBelgiumBelizeBeninBhutanBoliviaBosnia and HerzegovinaBotswanaBrazilBrunei DarussalamBulgariaBurkina FasoBurundiCabo VerdeCambodiaCameroonCanadaCaribbean small statesCentral African RepublicCentral Europe and the BalticsChadChannel IslandsChileChinaColombiaComorosCongo, Dem. Rep.Congo, Rep.Costa RicaCote d'IvoireCroatiaCubaCuracaoCyprusCzech RepublicDenmarkDjiboutiDominicaDominican RepublicEarly-demographic dividendEast Asia & PacificEast Asia & Pacific (excluding high income)East Asia & Pacific (IDA & IBRD countries)EcuadorEgypt, Arab Rep.El SalvadorEquatorial GuineaEritreaEstoniaEthiopiaEuro areaEurope & Central AsiaEurope & Central Asia (excluding high income)Europe & Central Asia (IDA & IBRD countries)European UnionFijiFinlandFragile and conflict affected situationsFranceFrench PolynesiaGabonGambia, TheGeorgiaGermanyGhanaGreeceGreenlandGrenadaGuamGuatemalaGuineaGuinea-BissauGuyanaHaitiHeavily indebted poor countries (HIPC)High incomeHondurasHong Kong SAR, ChinaHungaryIBRD onlyIcelandIDA & IBRD totalIDA blendIDA onlyIDA totalIndiaIndonesiaIran, Islamic Rep.IraqIrelandIsraelItalyJamaicaJapanJordanKazakhstanKenyaKiribatiKorea, Dem. People’s Rep.Korea, Rep.KuwaitKyrgyz RepublicLao PDRLate-demographic dividendLatin America & Caribbean Latin America & Caribbean (excluding high income)Latin America & the Caribbean (IDA & IBRD countries)LatviaLeast developed countries: UN classificationLebanonLesothoLiberiaLibyaLithuaniaLow & middle incomeLow incomeLower middle incomeLuxembourgMacao SAR, ChinaMacedonia, FYRMadagascarMalawiMalaysiaMaldivesMaliMaltaMarshall IslandsMauritaniaMauritiusMexicoMicronesia, Fed. Sts.Middle East & North AfricaMiddle East & North Africa (excluding high income)Middle East & North Africa (IDA & IBRD countries)Middle incomeMoldovaMongoliaMontenegroMoroccoMozambiqueMyanmarNamibiaNepalNetherlandsNew CaledoniaNew ZealandNicaraguaNigerNigeriaNorth AmericaNorwayOECD membersOmanOther small statesPacific island small statesPakistanPanamaPapua New GuineaParaguayPeruPhilippinesPolandPortugalPost-demographic dividendPre-demographic dividendPuerto RicoQatarRomaniaRussian FederationRwandaSamoaSao Tome and PrincipeSaudi ArabiaSenegalSerbiaSeychellesSierra LeoneSingaporeSlovak RepublicSloveniaSmall statesSolomon IslandsSomaliaSouth AfricaSouth AsiaSouth Asia (IDA & IBRD)South SudanSpainSri LankaSt. Kitts and NevisSt. LuciaSt. Vincent and the GrenadinesSub-Saharan Africa Sub-Saharan Africa (excluding high income)Sub-Saharan Africa (IDA & IBRD countries)SudanSurinameSwazilandSwedenSwitzerlandSyrian Arab RepublicTajikistanTanzaniaThailandTimor-LesteTogoTongaTrinidad and TobagoTunisiaTurkeyTurkmenistanUgandaUkraineUnited Arab EmiratesUnited KingdomUnited StatesUpper middle incomeUruguayUzbekistanVanuatuVenezuela, RBVietnamVirgin Islands (U.S.)West Bank and GazaWorldYemen, Rep.ZambiaZimbabwe Linha do tempo:
Nesta escala de tempo está apresentado um gráfico de 1961 ano até 2015 ano Montenegro. Dados de 1960 ano ausente. O número de observações reais por data: 55.
Fonte (nome):
Indicadores de desenvolvimento mundial
Fonte (organização):
(1) United Nations Population Division. World Population Prospects. New York, United Nations, Department of Economic and Social Affairs (advanced Excel tables). Available at http://esa.un.org/wpp/unpp/panel_population.htm, (2) University of California, Berkeley, and Max Planck Institute for Demographic Research. Human Mortality Database. [ www.mortality.org or www.humanmortality.de].
Categorias:
Health, Gender
Foi atualizado:
23 abr 2017 ano
Indicadores de alterações dos valores ao longo dos anos
Mínimo:
130.08
1 jan 2015 ano
Máximo:
220.797
1 jan 1961 ano
Na data de observação
Valor
Mudança absoluta
A alteração em relação ao valor anterior
1 jan 1961 ano
220.797
+220.797
0.0%
1 jan 1962 ano
216.925
-3.872
-1.75%
1 jan 1963 ano
213.053
-3.872
-1.78%
1 jan 1964 ano
211.687
-1.366
-0.64%
1 jan 1965 ano
210.321
-1.366
-0.65%
1 jan 1966 ano
208.955
-1.366
-0.65%
1 jan 1967 ano
207.589
-1.366
-0.65%
1 jan 1968 ano
206.223
-1.366
-0.66%
1 jan 1969 ano
204.673
-1.55
-0.75%
1 jan 1970 ano
203.123
-1.55
-0.76%
1 jan 1971 ano
201.573
-1.55
-0.76%
1 jan 1972 ano
200.023
-1.55
-0.77%
1 jan 1973 ano
198.473
-1.55
-0.77%
1 jan 1974 ano
197.394
-1.079
-0.54%
1 jan 1975 ano
196.316
-1.078
-0.55%
1 jan 1976 ano
195.237
-1.079
-0.55%
1 jan 1977 ano
194.158
-1.079
-0.55%
1 jan 1978 ano
193.08
-1.078
-0.56%
1 jan 1979 ano
188.402
-4.678
-2.42%
1 jan 1980 ano
183.725
-4.677
-2.48%
1 jan 1981 ano
179.048
-4.677
-2.55%
1 jan 1982 ano
174.371
-4.677
-2.61%
1 jan 1983 ano
169.694
-4.677
-2.68%
1 jan 1984 ano
169.094
-0.6
-0.35%
1 jan 1985 ano
168.495
-0.599
-0.35%
1 jan 1986 ano
167.895
-0.6
-0.36%
1 jan 1987 ano
167.296
-0.599
-0.36%
1 jan 1988 ano
166.696
-0.6
-0.36%
1 jan 1989 ano
166.109
-0.587
-0.35%
1 jan 1990 ano
165.521
-0.588
-0.35%
1 jan 1991 ano
164.934
-0.587
-0.35%
1 jan 1992 ano
164.347
-0.587
-0.36%
1 jan 1993 ano
163.759
-0.588
-0.36%
1 jan 1994 ano
166.9
+3.141
1.92%
1 jan 1995 ano
170.041
+3.141
1.88%
1 jan 1996 ano
173.182
+3.141
1.85%
1 jan 1997 ano
176.323
+3.141
1.81%
1 jan 1998 ano
179.464
+3.141
1.78%
1 jan 1999 ano
179.464
0.0
0.0%
1 jan 2000 ano
179.464
0.0
0.0%
1 jan 2001 ano
179.464
0.0
0.0%
1 jan 2002 ano
179.464
0.0
0.0%
1 jan 2003 ano
179.464
0.0
0.0%
1 jan 2004 ano
175.443
-4.021
-2.24%
1 jan 2005 ano
171.421
-4.022
-2.29%
1 jan 2006 ano
167.399
-4.022
-2.35%
1 jan 2007 ano
163.378
-4.021
-2.4%
1 jan 2008 ano
159.356
-4.022
-2.46%
1 jan 2009 ano
153.988
-5.368
-3.37%
1 jan 2010 ano
148.62
-5.368
-3.49%
1 jan 2011 ano
143.252
-5.368
-3.61%
1 jan 2012 ano
137.883
-5.369
-3.75%
1 jan 2013 ano
132.515
-5.368
-3.89%
1 jan 2014 ano
131.298
-1.217
-0.92%
1 jan 2015 ano
130.08
-1.218
-0.93%
Classificação de países por estatísticas atuais por anos


Comentários: