29
/pt/
pt
AIzaSyAYiBZKx7MnpbEhh9jyipgxe19OcubqV5w
April 1, 2024
159693
Ireland
IRL
true
2
1
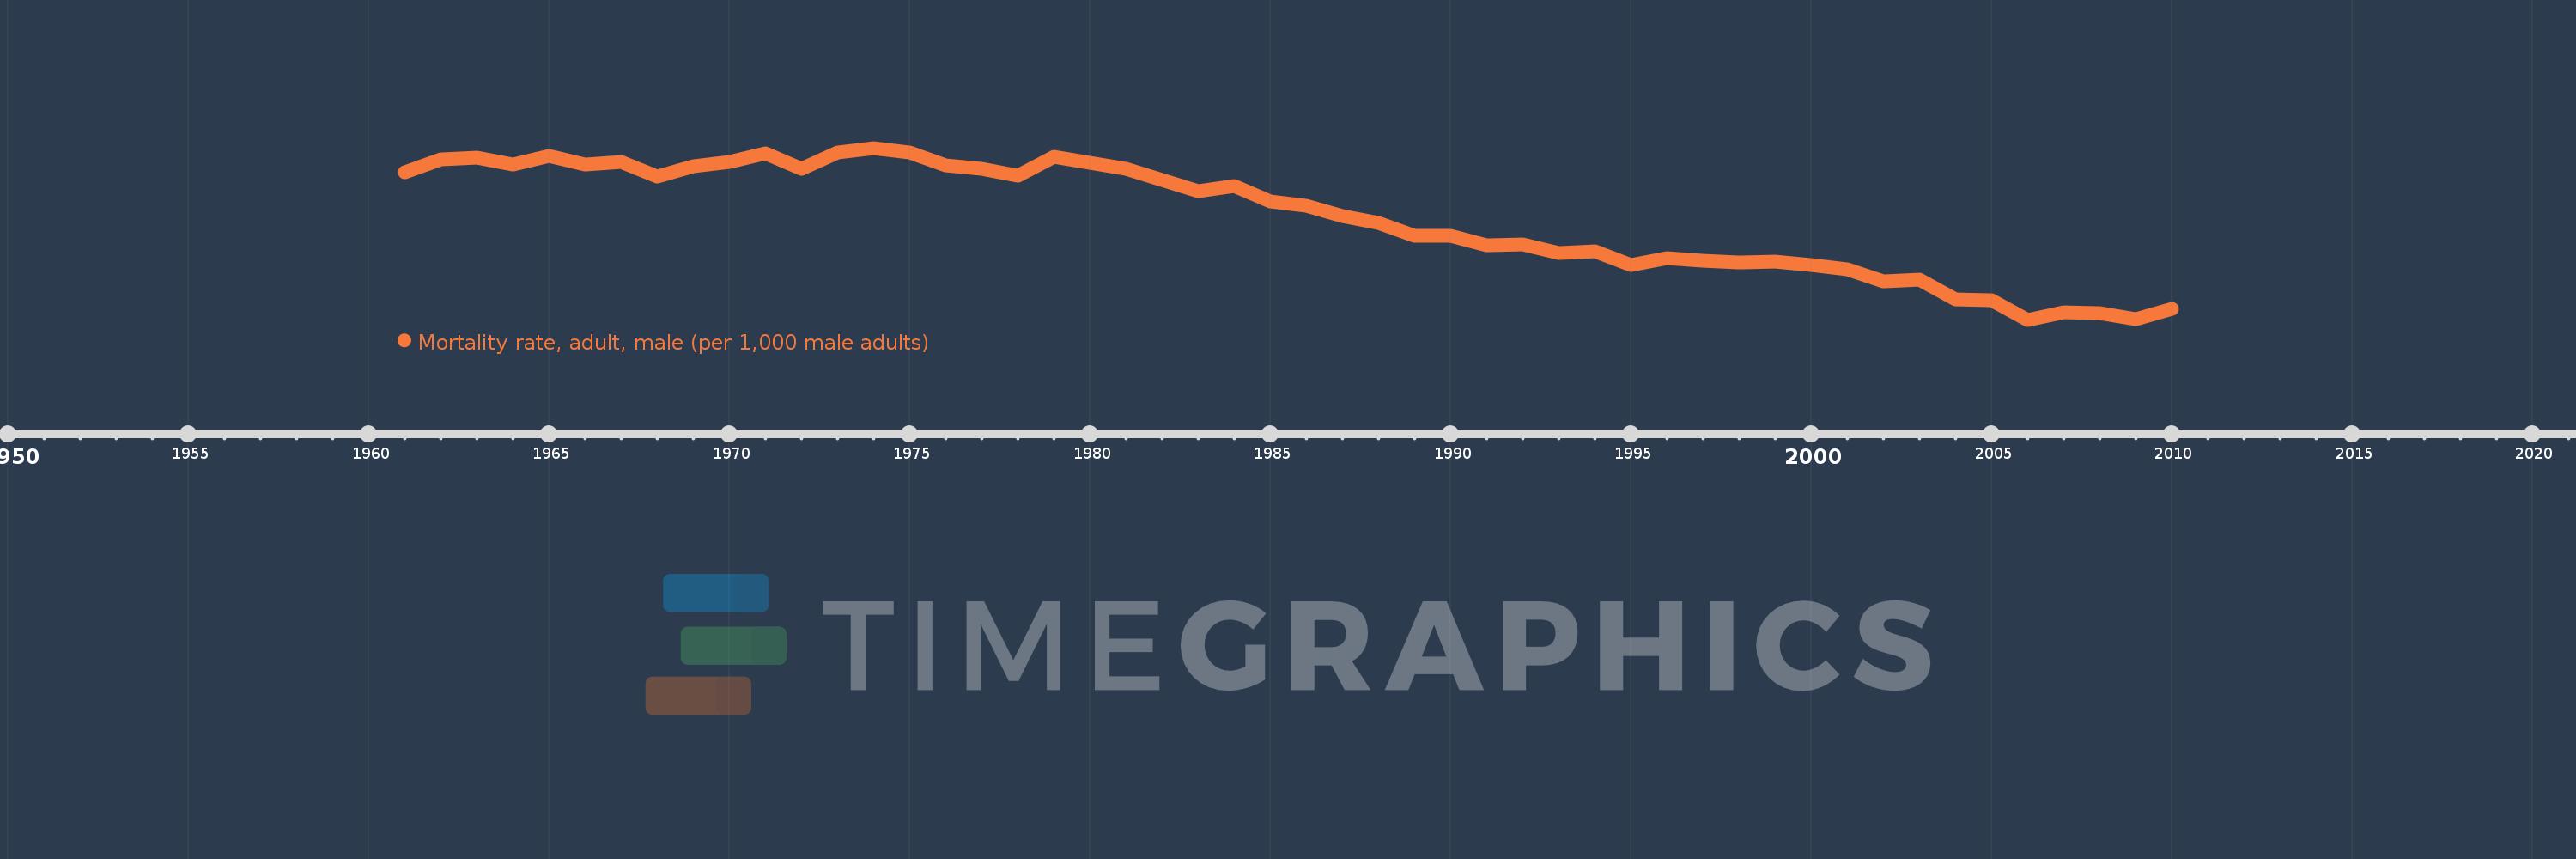
Mortality rate, adult, male (per 1,000 male adults)
2010,2009,2008,2007,2006,2005,2004,2003,2002,2001,2000,1999,1998,1997,1996,1995,1994,1993,1992,1991,1990,1989,1988,1987,1986,1985,1984,1983,1982,1981,1980,1979,1978,1977,1976,1975,1974,1973,1972,1971,1970,1969,1968,1967,1966,1965,1964,1963,1962,1961
Estas estatísticas em outros países:
AfghanistanAlbaniaAlgeriaAngolaAntigua and BarbudaArab WorldArgentinaArmeniaArubaAustraliaAustriaAzerbaijanBahamas, TheBahrainBangladeshBarbadosBelarusBelgiumBelizeBeninBhutanBoliviaBosnia and HerzegovinaBotswanaBrazilBrunei DarussalamBulgariaBurkina FasoBurundiCabo VerdeCambodiaCameroonCanadaCaribbean small statesCentral African RepublicCentral Europe and the BalticsChadChannel IslandsChileChinaColombiaComorosCongo, Dem. Rep.Congo, Rep.Costa RicaCote d'IvoireCroatiaCubaCuracaoCyprusCzech RepublicDenmarkDjiboutiDominicaDominican RepublicEarly-demographic dividendEast Asia & PacificEast Asia & Pacific (excluding high income)East Asia & Pacific (IDA & IBRD countries)EcuadorEgypt, Arab Rep.El SalvadorEquatorial GuineaEritreaEstoniaEthiopiaEuro areaEurope & Central AsiaEurope & Central Asia (excluding high income)Europe & Central Asia (IDA & IBRD countries)European UnionFijiFinlandFragile and conflict affected situationsFranceFrench PolynesiaGabonGambia, TheGeorgiaGermanyGhanaGreeceGreenlandGrenadaGuamGuatemalaGuineaGuinea-BissauGuyanaHaitiHeavily indebted poor countries (HIPC)High incomeHondurasHong Kong SAR, ChinaHungaryIBRD onlyIcelandIDA & IBRD totalIDA blendIDA onlyIDA totalIndiaIndonesiaIran, Islamic Rep.IraqIrelandIsraelItalyJamaicaJapanJordanKazakhstanKenyaKiribatiKorea, Dem. People’s Rep.Korea, Rep.KuwaitKyrgyz RepublicLao PDRLate-demographic dividendLatin America & Caribbean Latin America & Caribbean (excluding high income)Latin America & the Caribbean (IDA & IBRD countries)LatviaLeast developed countries: UN classificationLebanonLesothoLiberiaLibyaLithuaniaLow & middle incomeLow incomeLower middle incomeLuxembourgMacao SAR, ChinaMacedonia, FYRMadagascarMalawiMalaysiaMaldivesMaliMaltaMarshall IslandsMauritaniaMauritiusMexicoMicronesia, Fed. Sts.Middle East & North AfricaMiddle East & North Africa (excluding high income)Middle East & North Africa (IDA & IBRD countries)Middle incomeMoldovaMongoliaMontenegroMoroccoMozambiqueMyanmarNamibiaNepalNetherlandsNew CaledoniaNew ZealandNicaraguaNigerNigeriaNorth AmericaNorwayOECD membersOmanOther small statesPacific island small statesPakistanPanamaPapua New GuineaParaguayPeruPhilippinesPolandPortugalPost-demographic dividendPre-demographic dividendPuerto RicoQatarRomaniaRussian FederationRwandaSamoaSao Tome and PrincipeSaudi ArabiaSenegalSerbiaSeychellesSierra LeoneSingaporeSlovak RepublicSloveniaSmall statesSolomon IslandsSomaliaSouth AfricaSouth AsiaSouth Asia (IDA & IBRD)South SudanSpainSri LankaSt. Kitts and NevisSt. LuciaSt. Vincent and the GrenadinesSub-Saharan Africa Sub-Saharan Africa (excluding high income)Sub-Saharan Africa (IDA & IBRD countries)SudanSurinameSwazilandSwedenSwitzerlandSyrian Arab RepublicTajikistanTanzaniaThailandTimor-LesteTogoTongaTrinidad and TobagoTunisiaTurkeyTurkmenistanUgandaUkraineUnited Arab EmiratesUnited KingdomUnited StatesUpper middle incomeUruguayUzbekistanVanuatuVenezuela, RBVietnamVirgin Islands (U.S.)West Bank and GazaWorldYemen, Rep.ZambiaZimbabwe Linha do tempo:
Nesta escala de tempo está apresentado um gráfico de 1961 ano até 2010 ano Ireland. Dados de 1960 ano ausente. O número de observações reais por data: 50.
Fonte (nome):
Indicadores de desenvolvimento mundial
Fonte (organização):
(1) United Nations Population Division. World Population Prospects. New York, United Nations, Department of Economic and Social Affairs (advanced Excel tables). Available at http://esa.un.org/wpp/unpp/panel_population.htm, (2) University of California, Berkeley, and Max Planck Institute for Demographic Research. Human Mortality Database. [ www.mortality.org or www.humanmortality.de].
Categorias:
Health, Gender
Foi atualizado:
23 abr 2017 ano
Indicadores de alterações dos valores ao longo dos anos
Mínimo:
90.796
1 jan 2006 ano
Máximo:
187.231
1 jan 1974 ano
Na data de observação
Valor
Mudança absoluta
A alteração em relação ao valor anterior
1 jan 1961 ano
173.731
+173.731
0.0%
1 jan 1962 ano
181.021
+7.29
4.2%
1 jan 1963 ano
181.934
+0.913
0.5%
1 jan 1964 ano
177.799
-4.135
-2.27%
1 jan 1965 ano
182.654
+4.855
2.73%
1 jan 1966 ano
177.867
-4.787
-2.62%
1 jan 1967 ano
179.381
+1.514
0.85%
1 jan 1968 ano
171.271
-8.11
-4.52%
1 jan 1969 ano
177.153
+5.882
3.43%
1 jan 1970 ano
179.396
+2.243
1.27%
1 jan 1971 ano
184.105
+4.709
2.62%
1 jan 1972 ano
175.352
-8.753
-4.75%
1 jan 1973 ano
184.682
+9.33
5.32%
1 jan 1974 ano
187.231
+2.549
1.38%
1 jan 1975 ano
184.825
-2.406
-1.29%
1 jan 1976 ano
177.638
-7.187
-3.89%
1 jan 1977 ano
175.333
-2.305
-1.3%
1 jan 1978 ano
171.67
-3.663
-2.09%
1 jan 1979 ano
182.191
+10.521
6.13%
1 jan 1980 ano
178.899
-3.292
-1.81%
1 jan 1981 ano
175.563
-3.336
-1.86%
1 jan 1982 ano
169.437
-6.126
-3.49%
1 jan 1983 ano
162.925
-6.512
-3.84%
1 jan 1984 ano
166.04
+3.115
1.91%
1 jan 1985 ano
157.018
-9.022
-5.43%
1 jan 1986 ano
154.837
-2.181
-1.39%
1 jan 1987 ano
148.799
-6.038
-3.9%
1 jan 1988 ano
145.22
-3.579
-2.41%
1 jan 1989 ano
138.007
-7.213
-4.97%
1 jan 1990 ano
137.778
-0.229
-0.17%
1 jan 1991 ano
132.612
-5.166
-3.75%
1 jan 1992 ano
132.872
+0.26
0.2%
1 jan 1993 ano
128.179
-4.693
-3.53%
1 jan 1994 ano
129.119
+0.94
0.73%
1 jan 1995 ano
121.699
-7.42
-5.75%
1 jan 1996 ano
125.59
+3.891
3.2%
1 jan 1997 ano
123.899
-1.691
-1.35%
1 jan 1998 ano
123.067
-0.832
-0.67%
1 jan 1999 ano
123.619
+0.552
0.45%
1 jan 2000 ano
121.401
-2.218
-1.79%
1 jan 2001 ano
119.264
-2.137
-1.76%
1 jan 2002 ano
112.233
-7.031
-5.9%
1 jan 2003 ano
113.326
+1.093
0.97%
1 jan 2004 ano
102.249
-11.077
-9.77%
1 jan 2005 ano
101.723
-0.526
-0.51%
1 jan 2006 ano
90.796
-10.927
-10.74%
1 jan 2007 ano
94.792
+3.996
4.4%
1 jan 2008 ano
94.564
-0.228
-0.24%
1 jan 2009 ano
91.221
-3.343
-3.54%
1 jan 2010 ano
96.896
+5.675
6.22%
Classificação de países por estatísticas atuais por anos


Comentários: