29
/pt/
pt
AIzaSyAYiBZKx7MnpbEhh9jyipgxe19OcubqV5w
April 1, 2024
258610
Syrian Arab Republic
SYR
true
2
1
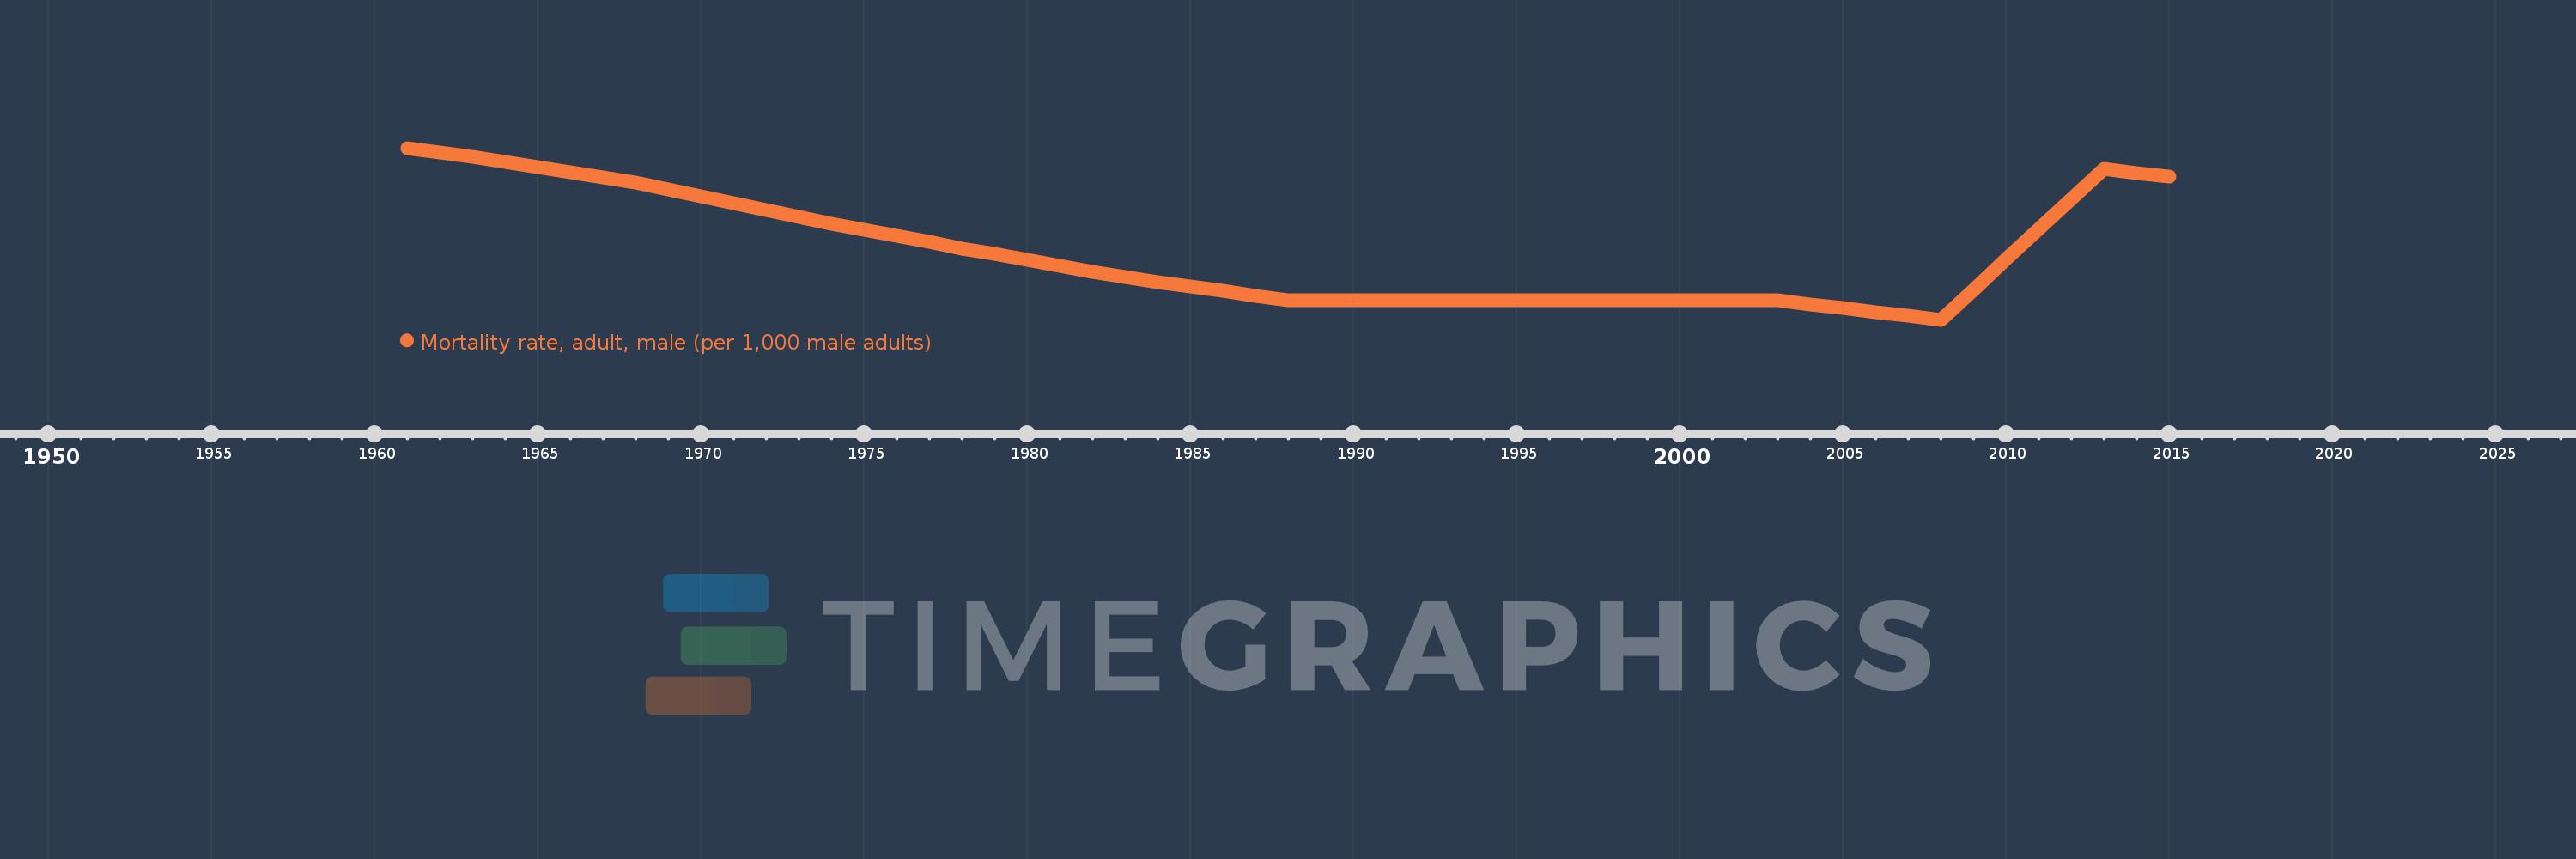
Mortality rate, adult, male (per 1,000 male adults)
2015,2014,2013,2012,2011,2010,2009,2008,2007,2006,2005,2004,2003,2002,2001,2000,1999,1998,1997,1996,1995,1994,1993,1992,1991,1990,1989,1988,1987,1986,1985,1984,1983,1982,1981,1980,1979,1978,1977,1976,1975,1974,1973,1972,1971,1970,1969,1968,1967,1966,1965,1964,1963,1962,1961
Estas estatísticas em outros países:
AfghanistanAlbaniaAlgeriaAngolaAntigua and BarbudaArab WorldArgentinaArmeniaArubaAustraliaAustriaAzerbaijanBahamas, TheBahrainBangladeshBarbadosBelarusBelgiumBelizeBeninBhutanBoliviaBosnia and HerzegovinaBotswanaBrazilBrunei DarussalamBulgariaBurkina FasoBurundiCabo VerdeCambodiaCameroonCanadaCaribbean small statesCentral African RepublicCentral Europe and the BalticsChadChannel IslandsChileChinaColombiaComorosCongo, Dem. Rep.Congo, Rep.Costa RicaCote d'IvoireCroatiaCubaCuracaoCyprusCzech RepublicDenmarkDjiboutiDominicaDominican RepublicEarly-demographic dividendEast Asia & PacificEast Asia & Pacific (excluding high income)East Asia & Pacific (IDA & IBRD countries)EcuadorEgypt, Arab Rep.El SalvadorEquatorial GuineaEritreaEstoniaEthiopiaEuro areaEurope & Central AsiaEurope & Central Asia (excluding high income)Europe & Central Asia (IDA & IBRD countries)European UnionFijiFinlandFragile and conflict affected situationsFranceFrench PolynesiaGabonGambia, TheGeorgiaGermanyGhanaGreeceGreenlandGrenadaGuamGuatemalaGuineaGuinea-BissauGuyanaHaitiHeavily indebted poor countries (HIPC)High incomeHondurasHong Kong SAR, ChinaHungaryIBRD onlyIcelandIDA & IBRD totalIDA blendIDA onlyIDA totalIndiaIndonesiaIran, Islamic Rep.IraqIrelandIsraelItalyJamaicaJapanJordanKazakhstanKenyaKiribatiKorea, Dem. People’s Rep.Korea, Rep.KuwaitKyrgyz RepublicLao PDRLate-demographic dividendLatin America & Caribbean Latin America & Caribbean (excluding high income)Latin America & the Caribbean (IDA & IBRD countries)LatviaLeast developed countries: UN classificationLebanonLesothoLiberiaLibyaLithuaniaLow & middle incomeLow incomeLower middle incomeLuxembourgMacao SAR, ChinaMacedonia, FYRMadagascarMalawiMalaysiaMaldivesMaliMaltaMarshall IslandsMauritaniaMauritiusMexicoMicronesia, Fed. Sts.Middle East & North AfricaMiddle East & North Africa (excluding high income)Middle East & North Africa (IDA & IBRD countries)Middle incomeMoldovaMongoliaMontenegroMoroccoMozambiqueMyanmarNamibiaNepalNetherlandsNew CaledoniaNew ZealandNicaraguaNigerNigeriaNorth AmericaNorwayOECD membersOmanOther small statesPacific island small statesPakistanPanamaPapua New GuineaParaguayPeruPhilippinesPolandPortugalPost-demographic dividendPre-demographic dividendPuerto RicoQatarRomaniaRussian FederationRwandaSamoaSao Tome and PrincipeSaudi ArabiaSenegalSerbiaSeychellesSierra LeoneSingaporeSlovak RepublicSloveniaSmall statesSolomon IslandsSomaliaSouth AfricaSouth AsiaSouth Asia (IDA & IBRD)South SudanSpainSri LankaSt. Kitts and NevisSt. LuciaSt. Vincent and the GrenadinesSub-Saharan Africa Sub-Saharan Africa (excluding high income)Sub-Saharan Africa (IDA & IBRD countries)SudanSurinameSwazilandSwedenSwitzerlandSyrian Arab RepublicTajikistanTanzaniaThailandTimor-LesteTogoTongaTrinidad and TobagoTunisiaTurkeyTurkmenistanUgandaUkraineUnited Arab EmiratesUnited KingdomUnited StatesUpper middle incomeUruguayUzbekistanVanuatuVenezuela, RBVietnamVirgin Islands (U.S.)West Bank and GazaWorldYemen, Rep.ZambiaZimbabwe Linha do tempo:
Nesta escala de tempo está apresentado um gráfico de 1961 ano até 2015 ano Syrian Arab Republic. Dados de 1960 ano ausente. O número de observações reais por data: 55.
Fonte (nome):
Indicadores de desenvolvimento mundial
Fonte (organização):
(1) United Nations Population Division. World Population Prospects. New York, United Nations, Department of Economic and Social Affairs (advanced Excel tables). Available at http://esa.un.org/wpp/unpp/panel_population.htm, (2) University of California, Berkeley, and Max Planck Institute for Demographic Research. Human Mortality Database. [ www.mortality.org or www.humanmortality.de].
Categorias:
Health, Gender
Foi atualizado:
23 abr 2017 ano
Indicadores de alterações dos valores ao longo dos anos
Mínimo:
148.8
1 jan 2008 ano
Máximo:
309.55
1 jan 1961 ano
Na data de observação
Valor
Mudança absoluta
A alteração em relação ao valor anterior
1 jan 1961 ano
309.55
+309.55
0.0%
1 jan 1962 ano
305.583
-3.967
-1.28%
1 jan 1963 ano
301.616
-3.967
-1.3%
1 jan 1964 ano
296.748
-4.868
-1.61%
1 jan 1965 ano
291.88
-4.868
-1.64%
1 jan 1966 ano
287.012
-4.868
-1.67%
1 jan 1967 ano
282.144
-4.868
-1.7%
1 jan 1968 ano
277.276
-4.868
-1.73%
1 jan 1969 ano
270.774
-6.502
-2.34%
1 jan 1970 ano
264.273
-6.501
-2.4%
1 jan 1971 ano
257.771
-6.502
-2.46%
1 jan 1972 ano
251.27
-6.501
-2.52%
1 jan 1973 ano
244.768
-6.502
-2.59%
1 jan 1974 ano
238.916
-5.852
-2.39%
1 jan 1975 ano
233.065
-5.851
-2.45%
1 jan 1976 ano
227.213
-5.852
-2.51%
1 jan 1977 ano
221.361
-5.852
-2.58%
1 jan 1978 ano
215.509
-5.852
-2.64%
1 jan 1979 ano
210.103
-5.406
-2.51%
1 jan 1980 ano
204.697
-5.406
-2.57%
1 jan 1981 ano
199.291
-5.406
-2.64%
1 jan 1982 ano
193.884
-5.407
-2.71%
1 jan 1983 ano
188.478
-5.406
-2.79%
1 jan 1984 ano
184.182
-4.296
-2.28%
1 jan 1985 ano
179.885
-4.297
-2.33%
1 jan 1986 ano
175.589
-4.296
-2.39%
1 jan 1987 ano
171.293
-4.296
-2.45%
1 jan 1988 ano
166.996
-4.297
-2.51%
1 jan 1989 ano
167.004
+0.008
0.0%
1 jan 1990 ano
167.012
+0.008
0.0%
1 jan 1991 ano
167.02
+0.008
0.0%
1 jan 1992 ano
167.028
+0.008
0.0%
1 jan 1993 ano
167.035
+0.007
0.0%
1 jan 1994 ano
167.034
-0.001
0.0%
1 jan 1995 ano
167.032
-0.002
0.0%
1 jan 1996 ano
167.03
-0.002
0.0%
1 jan 1997 ano
167.028
-0.002
0.0%
1 jan 1998 ano
167.027
-0.001
0.0%
1 jan 1999 ano
167.025
-0.002
0.0%
1 jan 2000 ano
167.023
-0.002
0.0%
1 jan 2001 ano
167.022
-0.001
0.0%
1 jan 2002 ano
167.02
-0.002
0.0%
1 jan 2003 ano
167.019
-0.001
0.0%
1 jan 2004 ano
163.375
-3.644
-2.18%
1 jan 2005 ano
159.731
-3.644
-2.23%
1 jan 2006 ano
156.087
-3.644
-2.28%
1 jan 2007 ano
152.444
-3.643
-2.33%
1 jan 2008 ano
148.8
-3.644
-2.39%
1 jan 2009 ano
177.02
+28.22
18.97%
1 jan 2010 ano
205.24
+28.22
15.94%
1 jan 2011 ano
233.46
+28.22
13.75%
1 jan 2012 ano
261.68
+28.22
12.09%
1 jan 2013 ano
289.901
+28.221
10.78%
1 jan 2014 ano
286.272
-3.629
-1.25%
1 jan 2015 ano
282.644
-3.628
-1.27%
Classificação de países por estatísticas atuais por anos


Comentários: