29
/pt/
pt
AIzaSyAYiBZKx7MnpbEhh9jyipgxe19OcubqV5w
April 1, 2024
47382
Lower middle income
LMC
false
2
1
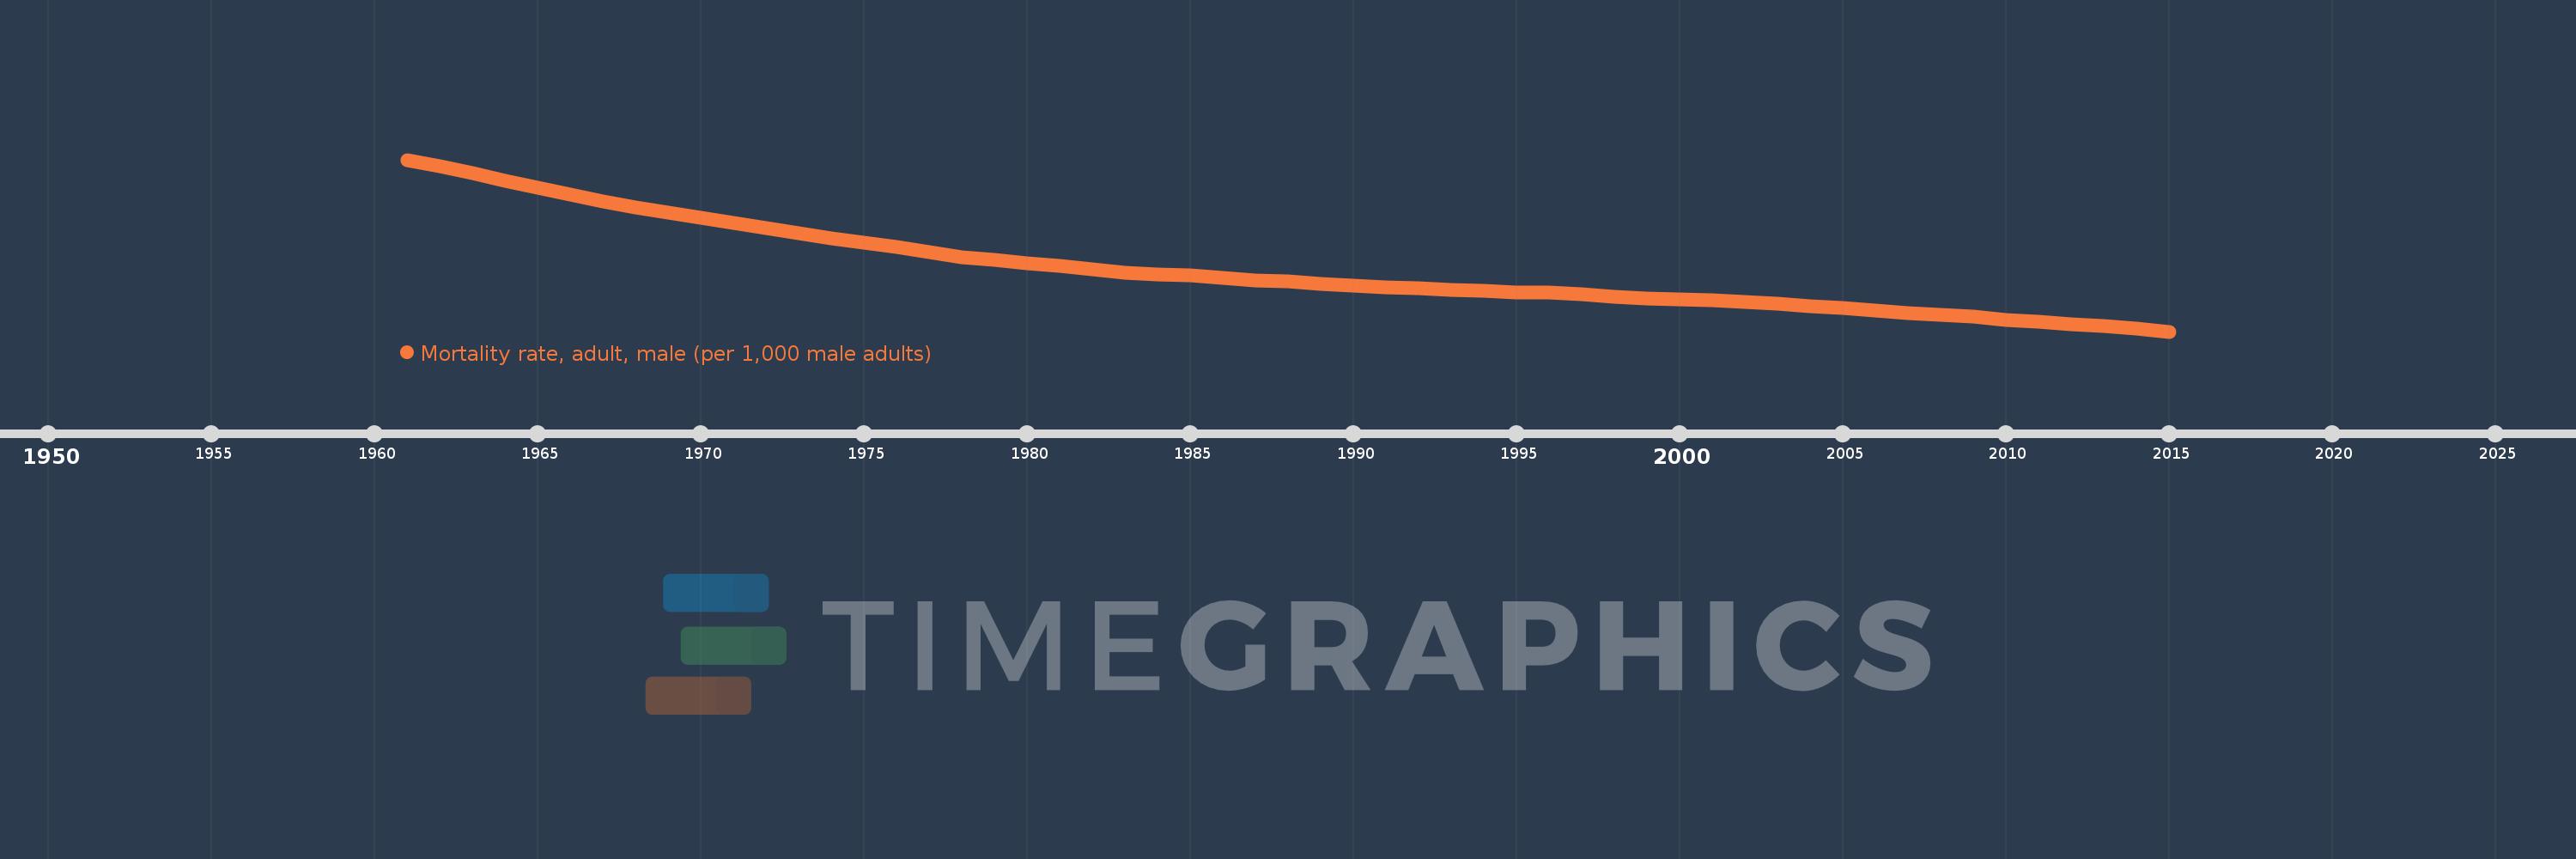
Mortality rate, adult, male (per 1,000 male adults)
2015,2014,2013,2012,2011,2010,2009,2008,2007,2006,2005,2004,2003,2002,2001,2000,1999,1998,1997,1996,1995,1994,1993,1992,1991,1990,1989,1988,1987,1986,1985,1984,1983,1982,1981,1980,1979,1978,1977,1976,1975,1974,1973,1972,1971,1970,1969,1968,1967,1966,1965,1964,1963,1962,1961
Estas estatísticas em outros países:
AfghanistanAlbaniaAlgeriaAngolaAntigua and BarbudaArab WorldArgentinaArmeniaArubaAustraliaAustriaAzerbaijanBahamas, TheBahrainBangladeshBarbadosBelarusBelgiumBelizeBeninBhutanBoliviaBosnia and HerzegovinaBotswanaBrazilBrunei DarussalamBulgariaBurkina FasoBurundiCabo VerdeCambodiaCameroonCanadaCaribbean small statesCentral African RepublicCentral Europe and the BalticsChadChannel IslandsChileChinaColombiaComorosCongo, Dem. Rep.Congo, Rep.Costa RicaCote d'IvoireCroatiaCubaCuracaoCyprusCzech RepublicDenmarkDjiboutiDominicaDominican RepublicEarly-demographic dividendEast Asia & PacificEast Asia & Pacific (excluding high income)East Asia & Pacific (IDA & IBRD countries)EcuadorEgypt, Arab Rep.El SalvadorEquatorial GuineaEritreaEstoniaEthiopiaEuro areaEurope & Central AsiaEurope & Central Asia (excluding high income)Europe & Central Asia (IDA & IBRD countries)European UnionFijiFinlandFragile and conflict affected situationsFranceFrench PolynesiaGabonGambia, TheGeorgiaGermanyGhanaGreeceGreenlandGrenadaGuamGuatemalaGuineaGuinea-BissauGuyanaHaitiHeavily indebted poor countries (HIPC)High incomeHondurasHong Kong SAR, ChinaHungaryIBRD onlyIcelandIDA & IBRD totalIDA blendIDA onlyIDA totalIndiaIndonesiaIran, Islamic Rep.IraqIrelandIsraelItalyJamaicaJapanJordanKazakhstanKenyaKiribatiKorea, Dem. People’s Rep.Korea, Rep.KuwaitKyrgyz RepublicLao PDRLate-demographic dividendLatin America & Caribbean Latin America & Caribbean (excluding high income)Latin America & the Caribbean (IDA & IBRD countries)LatviaLeast developed countries: UN classificationLebanonLesothoLiberiaLibyaLithuaniaLow & middle incomeLow incomeLower middle incomeLuxembourgMacao SAR, ChinaMacedonia, FYRMadagascarMalawiMalaysiaMaldivesMaliMaltaMarshall IslandsMauritaniaMauritiusMexicoMicronesia, Fed. Sts.Middle East & North AfricaMiddle East & North Africa (excluding high income)Middle East & North Africa (IDA & IBRD countries)Middle incomeMoldovaMongoliaMontenegroMoroccoMozambiqueMyanmarNamibiaNepalNetherlandsNew CaledoniaNew ZealandNicaraguaNigerNigeriaNorth AmericaNorwayOECD membersOmanOther small statesPacific island small statesPakistanPanamaPapua New GuineaParaguayPeruPhilippinesPolandPortugalPost-demographic dividendPre-demographic dividendPuerto RicoQatarRomaniaRussian FederationRwandaSamoaSao Tome and PrincipeSaudi ArabiaSenegalSerbiaSeychellesSierra LeoneSingaporeSlovak RepublicSloveniaSmall statesSolomon IslandsSomaliaSouth AfricaSouth AsiaSouth Asia (IDA & IBRD)South SudanSpainSri LankaSt. Kitts and NevisSt. LuciaSt. Vincent and the GrenadinesSub-Saharan Africa Sub-Saharan Africa (excluding high income)Sub-Saharan Africa (IDA & IBRD countries)SudanSurinameSwazilandSwedenSwitzerlandSyrian Arab RepublicTajikistanTanzaniaThailandTimor-LesteTogoTongaTrinidad and TobagoTunisiaTurkeyTurkmenistanUgandaUkraineUnited Arab EmiratesUnited KingdomUnited StatesUpper middle incomeUruguayUzbekistanVanuatuVenezuela, RBVietnamVirgin Islands (U.S.)West Bank and GazaWorldYemen, Rep.ZambiaZimbabwe Linha do tempo:
Nesta escala de tempo está apresentado um gráfico de 1961 ano até 2015 ano Lower middle income. Dados de 1960 ano ausente. O número de observações reais por data: 55.
Fonte (nome):
Indicadores de desenvolvimento mundial
Fonte (organização):
(1) United Nations Population Division. World Population Prospects. New York, United Nations, Department of Economic and Social Affairs (advanced Excel tables). Available at http://esa.un.org/wpp/unpp/panel_population.htm, (2) University of California, Berkeley, and Max Planck Institute for Demographic Research. Human Mortality Database. [ www.mortality.org or www.humanmortality.de].
Categorias:
Health, Gender
Foi atualizado:
23 abr 2017 ano
Indicadores de alterações dos valores ao longo dos anos
Mínimo:
222.877
1 jan 2015 ano
Máximo:
411.66
1 jan 1961 ano
Na data de observação
Valor
Mudança absoluta
A alteração em relação ao valor anterior
1 jan 1961 ano
411.66
+411.66
0.0%
1 jan 1962 ano
404.18
-7.48
-1.82%
1 jan 1963 ano
396.734
-7.447
-1.84%
1 jan 1964 ano
388.908
-7.826
-1.97%
1 jan 1965 ano
380.965
-7.943
-2.04%
1 jan 1966 ano
373.855
-7.11
-1.87%
1 jan 1967 ano
366.313
-7.542
-2.02%
1 jan 1968 ano
359.073
-7.24
-1.98%
1 jan 1969 ano
353.419
-5.655
-1.57%
1 jan 1970 ano
348.087
-5.332
-1.51%
1 jan 1971 ano
342.414
-5.673
-1.63%
1 jan 1972 ano
336.63
-5.784
-1.69%
1 jan 1973 ano
330.75
-5.88
-1.75%
1 jan 1974 ano
325.426
-5.324
-1.61%
1 jan 1975 ano
320.275
-5.151
-1.58%
1 jan 1976 ano
315.474
-4.801
-1.5%
1 jan 1977 ano
309.941
-5.533
-1.75%
1 jan 1978 ano
304.907
-5.034
-1.62%
1 jan 1979 ano
301.538
-3.368
-1.1%
1 jan 1980 ano
298.217
-3.321
-1.1%
1 jan 1981 ano
294.82
-3.397
-1.14%
1 jan 1982 ano
291.344
-3.476
-1.18%
1 jan 1983 ano
287.771
-3.573
-1.23%
1 jan 1984 ano
285.973
-1.798
-0.62%
1 jan 1985 ano
284.485
-1.488
-0.52%
1 jan 1986 ano
282.104
-2.381
-0.84%
1 jan 1987 ano
279.241
-2.862
-1.01%
1 jan 1988 ano
277.778
-1.463
-0.52%
1 jan 1989 ano
275.453
-2.325
-0.84%
1 jan 1990 ano
273.7
-1.753
-0.64%
1 jan 1991 ano
271.818
-1.882
-0.69%
1 jan 1992 ano
270.182
-1.636
-0.6%
1 jan 1993 ano
268.538
-1.644
-0.61%
1 jan 1994 ano
267.263
-1.276
-0.48%
1 jan 1995 ano
266.196
-1.066
-0.4%
1 jan 1996 ano
265.43
-0.767
-0.29%
1 jan 1997 ano
263.581
-1.848
-0.7%
1 jan 1998 ano
261.437
-2.144
-0.81%
1 jan 1999 ano
259.309
-2.128
-0.81%
1 jan 2000 ano
258.067
-1.242
-0.48%
1 jan 2001 ano
256.863
-1.204
-0.47%
1 jan 2002 ano
255.228
-1.636
-0.64%
1 jan 2003 ano
253.804
-1.424
-0.56%
1 jan 2004 ano
251.194
-2.61
-1.03%
1 jan 2005 ano
248.821
-2.373
-0.94%
1 jan 2006 ano
246.427
-2.394
-0.96%
1 jan 2007 ano
243.446
-2.981
-1.21%
1 jan 2008 ano
241.087
-2.359
-0.97%
1 jan 2009 ano
238.944
-2.142
-0.89%
1 jan 2010 ano
235.868
-3.077
-1.29%
1 jan 2011 ano
233.428
-2.439
-1.03%
1 jan 2012 ano
231.171
-2.258
-0.97%
1 jan 2013 ano
229.126
-2.044
-0.88%
1 jan 2014 ano
226.533
-2.593
-1.13%
1 jan 2015 ano
222.877
-3.656
-1.61%
Classificação de países por estatísticas atuais por anos


Comentários: