29
/pt/
pt
AIzaSyAYiBZKx7MnpbEhh9jyipgxe19OcubqV5w
April 1, 2024
56206
Small states
SST
false
2
1
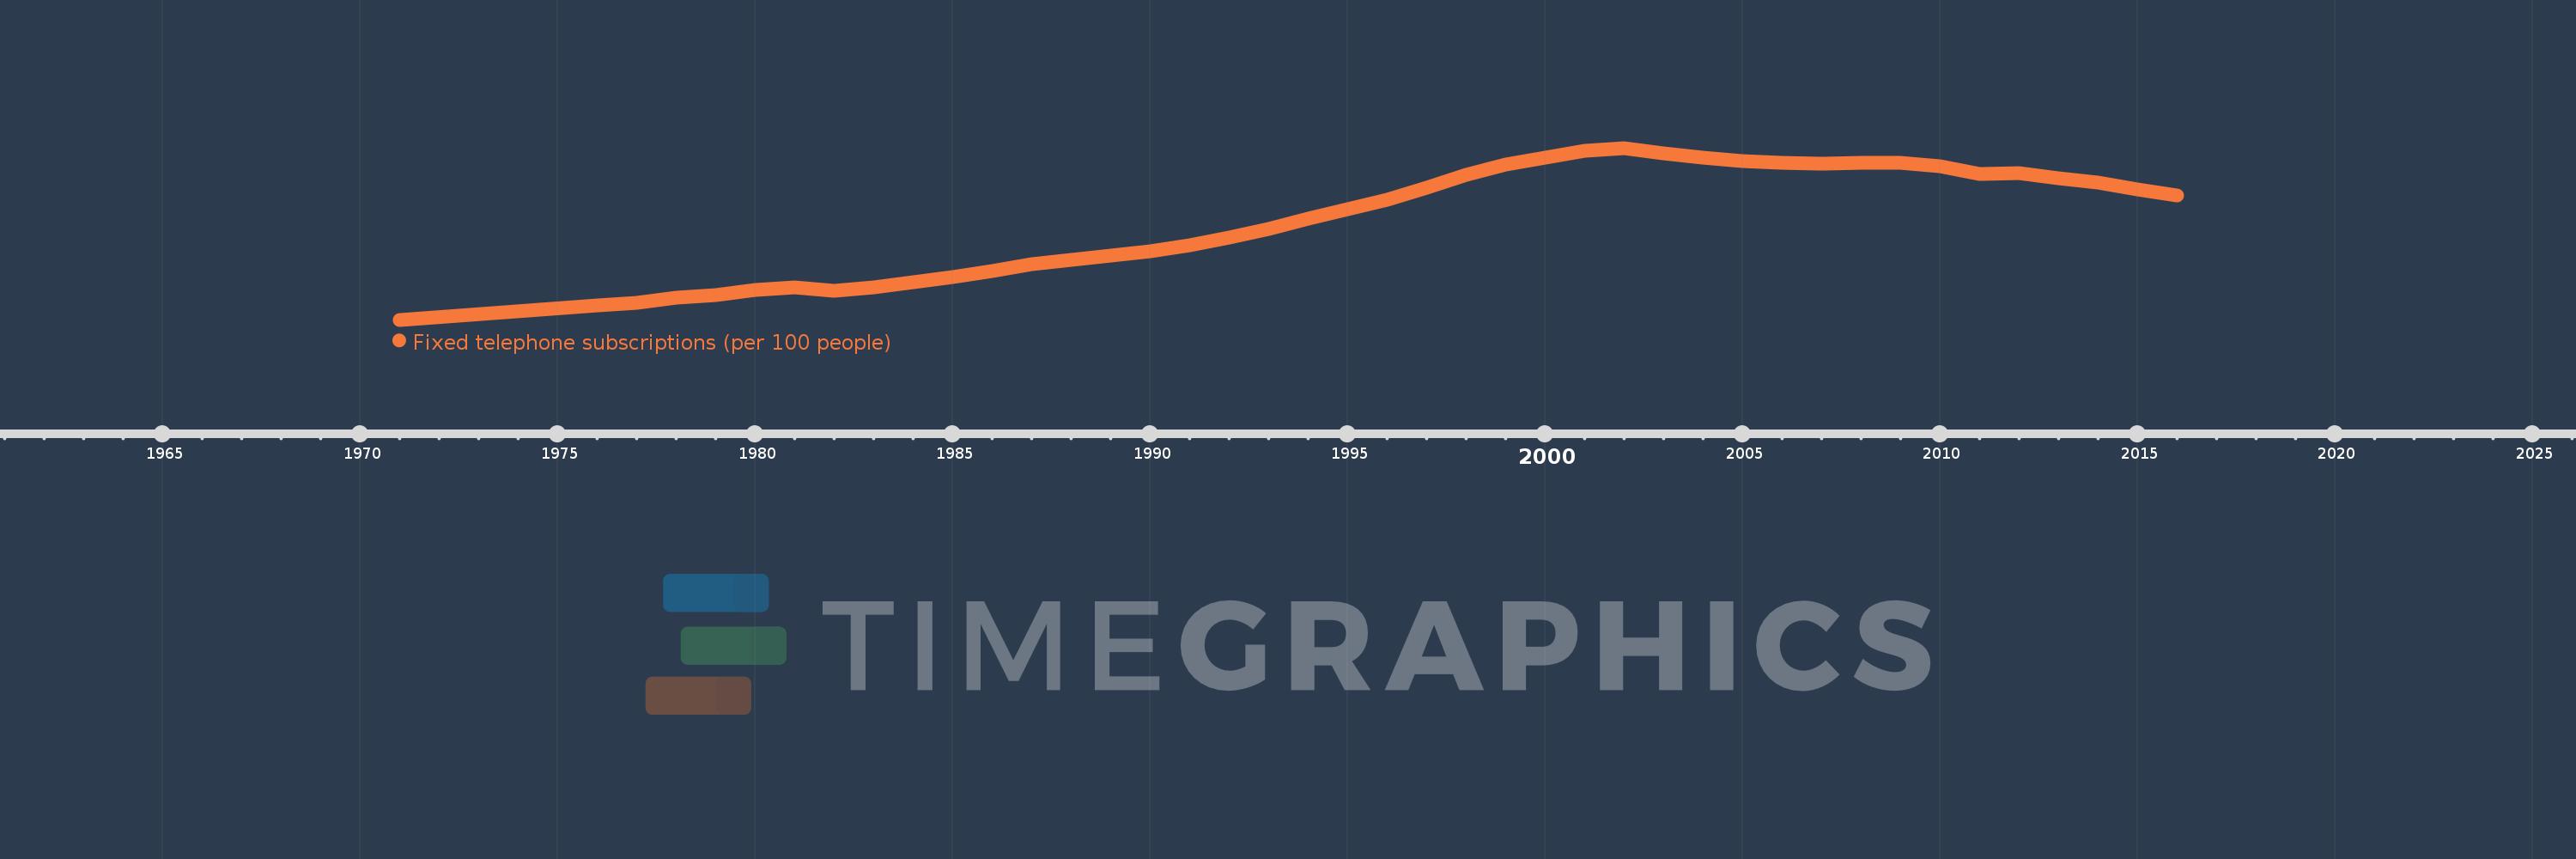
Fixed telephone subscriptions (per 100 people)
2016,2015,2014,2013,2012,2011,2010,2009,2008,2007,2006,2005,2004,2003,2002,2001,2000,1999,1998,1997,1996,1995,1994,1993,1992,1991,1990,1989,1988,1987,1986,1985,1984,1983,1982,1981,1980,1979,1978,1977,1976,1971
Estas estatísticas em outros países:
AfghanistanAlbaniaAlgeriaAmerican SamoaAndorraAngolaAntigua and BarbudaArab WorldArgentinaArmeniaArubaAustraliaAustriaAzerbaijanBahamas, TheBahrainBangladeshBarbadosBelarusBelgiumBelizeBeninBermudaBhutanBoliviaBosnia and HerzegovinaBotswanaBrazilBritish Virgin IslandsBrunei DarussalamBulgariaBurkina FasoBurundiCabo VerdeCambodiaCameroonCanadaCaribbean small statesCayman IslandsCentral African RepublicCentral Europe and the BalticsChadChileChinaColombiaComorosCongo, Dem. Rep.Congo, Rep.Costa RicaCote d'IvoireCroatiaCubaCuracaoCyprusCzech RepublicDenmarkDjiboutiDominicaDominican RepublicEarly-demographic dividendEast Asia & PacificEast Asia & Pacific (excluding high income)East Asia & Pacific (IDA & IBRD countries)EcuadorEgypt, Arab Rep.El SalvadorEquatorial GuineaEritreaEstoniaEthiopiaEuro areaEurope & Central AsiaEurope & Central Asia (excluding high income)Europe & Central Asia (IDA & IBRD countries)European UnionFaroe IslandsFijiFinlandFragile and conflict affected situationsFranceFrench PolynesiaGabonGambia, TheGeorgiaGermanyGhanaGibraltarGreeceGreenlandGrenadaGuamGuatemalaGuineaGuinea-BissauGuyanaHaitiHeavily indebted poor countries (HIPC)High incomeHondurasHong Kong SAR, ChinaHungaryIBRD onlyIcelandIDA & IBRD totalIDA blendIDA onlyIDA totalIndiaIndonesiaIran, Islamic Rep.IraqIrelandIsraelItalyJamaicaJapanJordanKazakhstanKenyaKiribatiKorea, Dem. People’s Rep.Korea, Rep.KosovoKuwaitKyrgyz RepublicLao PDRLate-demographic dividendLatin America & Caribbean Latin America & Caribbean (excluding high income)Latin America & the Caribbean (IDA & IBRD countries)LatviaLeast developed countries: UN classificationLebanonLesothoLiberiaLibyaLiechtensteinLithuaniaLow & middle incomeLow incomeLower middle incomeLuxembourgMacao SAR, ChinaMacedonia, FYRMadagascarMalawiMalaysiaMaldivesMaliMaltaMarshall IslandsMauritaniaMauritiusMexicoMicronesia, Fed. Sts.Middle East & North AfricaMiddle East & North Africa (excluding high income)Middle East & North Africa (IDA & IBRD countries)Middle incomeMoldovaMonacoMongoliaMontenegroMoroccoMozambiqueMyanmarNamibiaNauruNepalNetherlandsNew CaledoniaNew ZealandNicaraguaNigerNigeriaNorth AmericaNorthern Mariana IslandsNorwayOECD membersOmanOther small statesPacific island small statesPakistanPalauPanamaPapua New GuineaParaguayPeruPhilippinesPolandPortugalPost-demographic dividendPre-demographic dividendPuerto RicoQatarRomaniaRussian FederationRwandaSamoaSan MarinoSao Tome and PrincipeSaudi ArabiaSenegalSerbiaSeychellesSierra LeoneSingaporeSlovak RepublicSloveniaSmall statesSolomon IslandsSomaliaSouth AfricaSouth AsiaSouth Asia (IDA & IBRD)South SudanSpainSri LankaSt. Kitts and NevisSt. LuciaSt. Vincent and the GrenadinesSub-Saharan Africa Sub-Saharan Africa (excluding high income)Sub-Saharan Africa (IDA & IBRD countries)SudanSurinameSwazilandSwedenSwitzerlandSyrian Arab RepublicTajikistanTanzaniaThailandTimor-LesteTogoTongaTrinidad and TobagoTunisiaTurkeyTurkmenistanTurks and Caicos IslandsTuvaluUgandaUkraineUnited Arab EmiratesUnited KingdomUnited StatesUpper middle incomeUruguayUzbekistanVanuatuVenezuela, RBVietnamVirgin Islands (U.S.)West Bank and GazaWorldYemen, Rep.ZambiaZimbabwe Linha do tempo:
Nesta escala de tempo está apresentado um gráfico de 1971 ano até 2016 ano Small states. Dados de 1970 ano ausente. O número de observações reais por data: 42.
Fonte (nome):
Indicadores de desenvolvimento mundial
Fonte (organização):
International Telecommunication Union, World Telecommunication/ICT Development Report and database.
Categorias:
Infrastructure
Foi atualizado:
23 abr 2017 ano
Indicadores de alterações dos valores ao longo dos anos
Mínimo:
2.622
1 jan 1971 ano
Máximo:
15.181
1 jan 2002 ano
Na data de observação
Valor
Mudança absoluta
A alteração em relação ao valor anterior
1 jan 1971 ano
2.622
+2.622
0.0%
1 jan 1976 ano
3.683
+1.061
40.46%
1 jan 1977 ano
3.871
+0.188
5.1%
1 jan 1978 ano
4.242
+0.371
9.59%
1 jan 1979 ano
4.454
+0.211
4.98%
1 jan 1980 ano
4.776
+0.322
7.23%
1 jan 1981 ano
5.004
+0.228
4.78%
1 jan 1982 ano
4.765
-0.239
-4.78%
1 jan 1983 ano
5.005
+0.241
5.06%
1 jan 1984 ano
5.388
+0.382
7.64%
1 jan 1985 ano
5.746
+0.359
6.66%
1 jan 1986 ano
6.189
+0.443
7.71%
1 jan 1987 ano
6.654
+0.465
7.51%
1 jan 1988 ano
7.01
+0.356
5.36%
1 jan 1989 ano
7.335
+0.325
4.64%
1 jan 1990 ano
7.635
+0.3
4.09%
1 jan 1991 ano
8.085
+0.45
5.9%
1 jan 1992 ano
8.628
+0.543
6.71%
1 jan 1993 ano
9.285
+0.657
7.61%
1 jan 1994 ano
10.035
+0.75
8.08%
1 jan 1995 ano
10.73
+0.695
6.93%
1 jan 1996 ano
11.381
+0.652
6.07%
1 jan 1997 ano
12.271
+0.89
7.82%
1 jan 1998 ano
13.226
+0.955
7.78%
1 jan 1999 ano
13.962
+0.736
5.57%
1 jan 2000 ano
14.474
+0.511
3.66%
1 jan 2001 ano
14.979
+0.505
3.49%
1 jan 2002 ano
15.181
+0.202
1.35%
1 jan 2003 ano
14.774
-0.407
-2.68%
1 jan 2004 ano
14.476
-0.298
-2.02%
1 jan 2005 ano
14.22
-0.256
-1.77%
1 jan 2006 ano
14.091
-0.129
-0.91%
1 jan 2007 ano
14.002
-0.088
-0.63%
1 jan 2008 ano
14.124
+0.122
0.87%
1 jan 2009 ano
14.089
-0.035
-0.25%
1 jan 2010 ano
13.872
-0.218
-1.54%
1 jan 2011 ano
13.303
-0.569
-4.1%
1 jan 2012 ano
13.358
+0.055
0.41%
1 jan 2013 ano
12.95
-0.407
-3.05%
1 jan 2014 ano
12.634
-0.317
-2.45%
1 jan 2015 ano
12.162
-0.472
-3.73%
1 jan 2016 ano
11.728
-0.434
-3.57%
Classificação de países por estatísticas atuais por anos


Comentários: