29
/pt/
pt
AIzaSyAYiBZKx7MnpbEhh9jyipgxe19OcubqV5w
April 1, 2024
52590
OECD members
OED
false
2
1
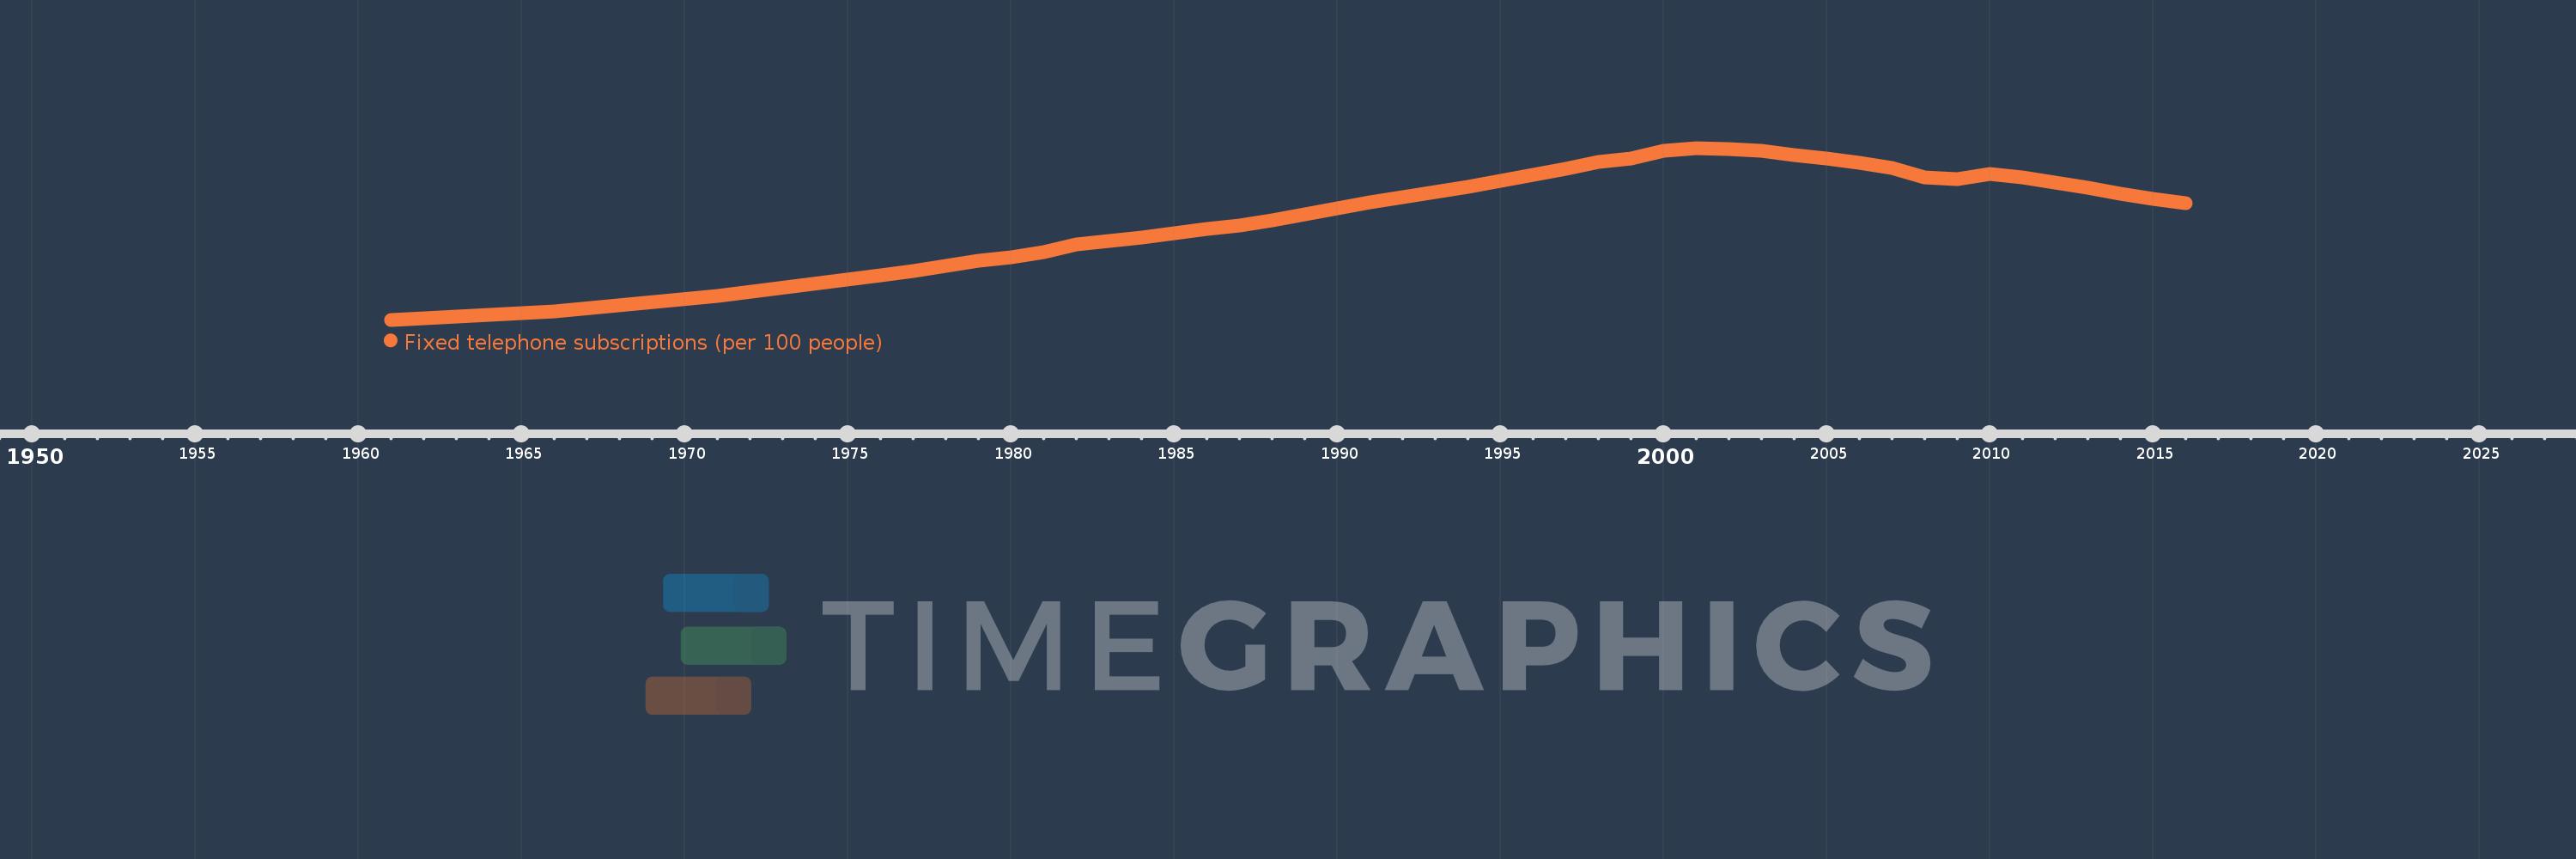
Fixed telephone subscriptions (per 100 people)
2016,2015,2014,2013,2012,2011,2010,2009,2008,2007,2006,2005,2004,2003,2002,2001,2000,1999,1998,1997,1996,1995,1994,1993,1992,1991,1990,1989,1988,1987,1986,1985,1984,1983,1982,1981,1980,1979,1978,1977,1976,1971,1966,1961
Estas estatísticas em outros países:
AfghanistanAlbaniaAlgeriaAmerican SamoaAndorraAngolaAntigua and BarbudaArab WorldArgentinaArmeniaArubaAustraliaAustriaAzerbaijanBahamas, TheBahrainBangladeshBarbadosBelarusBelgiumBelizeBeninBermudaBhutanBoliviaBosnia and HerzegovinaBotswanaBrazilBritish Virgin IslandsBrunei DarussalamBulgariaBurkina FasoBurundiCabo VerdeCambodiaCameroonCanadaCaribbean small statesCayman IslandsCentral African RepublicCentral Europe and the BalticsChadChileChinaColombiaComorosCongo, Dem. Rep.Congo, Rep.Costa RicaCote d'IvoireCroatiaCubaCuracaoCyprusCzech RepublicDenmarkDjiboutiDominicaDominican RepublicEarly-demographic dividendEast Asia & PacificEast Asia & Pacific (excluding high income)East Asia & Pacific (IDA & IBRD countries)EcuadorEgypt, Arab Rep.El SalvadorEquatorial GuineaEritreaEstoniaEthiopiaEuro areaEurope & Central AsiaEurope & Central Asia (excluding high income)Europe & Central Asia (IDA & IBRD countries)European UnionFaroe IslandsFijiFinlandFragile and conflict affected situationsFranceFrench PolynesiaGabonGambia, TheGeorgiaGermanyGhanaGibraltarGreeceGreenlandGrenadaGuamGuatemalaGuineaGuinea-BissauGuyanaHaitiHeavily indebted poor countries (HIPC)High incomeHondurasHong Kong SAR, ChinaHungaryIBRD onlyIcelandIDA & IBRD totalIDA blendIDA onlyIDA totalIndiaIndonesiaIran, Islamic Rep.IraqIrelandIsraelItalyJamaicaJapanJordanKazakhstanKenyaKiribatiKorea, Dem. People’s Rep.Korea, Rep.KosovoKuwaitKyrgyz RepublicLao PDRLate-demographic dividendLatin America & Caribbean Latin America & Caribbean (excluding high income)Latin America & the Caribbean (IDA & IBRD countries)LatviaLeast developed countries: UN classificationLebanonLesothoLiberiaLibyaLiechtensteinLithuaniaLow & middle incomeLow incomeLower middle incomeLuxembourgMacao SAR, ChinaMacedonia, FYRMadagascarMalawiMalaysiaMaldivesMaliMaltaMarshall IslandsMauritaniaMauritiusMexicoMicronesia, Fed. Sts.Middle East & North AfricaMiddle East & North Africa (excluding high income)Middle East & North Africa (IDA & IBRD countries)Middle incomeMoldovaMonacoMongoliaMontenegroMoroccoMozambiqueMyanmarNamibiaNauruNepalNetherlandsNew CaledoniaNew ZealandNicaraguaNigerNigeriaNorth AmericaNorthern Mariana IslandsNorwayOECD membersOmanOther small statesPacific island small statesPakistanPalauPanamaPapua New GuineaParaguayPeruPhilippinesPolandPortugalPost-demographic dividendPre-demographic dividendPuerto RicoQatarRomaniaRussian FederationRwandaSamoaSan MarinoSao Tome and PrincipeSaudi ArabiaSenegalSerbiaSeychellesSierra LeoneSingaporeSlovak RepublicSloveniaSmall statesSolomon IslandsSomaliaSouth AfricaSouth AsiaSouth Asia (IDA & IBRD)South SudanSpainSri LankaSt. Kitts and NevisSt. LuciaSt. Vincent and the GrenadinesSub-Saharan Africa Sub-Saharan Africa (excluding high income)Sub-Saharan Africa (IDA & IBRD countries)SudanSurinameSwazilandSwedenSwitzerlandSyrian Arab RepublicTajikistanTanzaniaThailandTimor-LesteTogoTongaTrinidad and TobagoTunisiaTurkeyTurkmenistanTurks and Caicos IslandsTuvaluUgandaUkraineUnited Arab EmiratesUnited KingdomUnited StatesUpper middle incomeUruguayUzbekistanVanuatuVenezuela, RBVietnamVirgin Islands (U.S.)West Bank and GazaWorldYemen, Rep.ZambiaZimbabwe Linha do tempo:
Nesta escala de tempo está apresentado um gráfico de 1961 ano até 2016 ano OECD members. Dados de 1960 ano ausente. O número de observações reais por data: 44.
Fonte (nome):
Indicadores de desenvolvimento mundial
Fonte (organização):
International Telecommunication Union, World Telecommunication/ICT Development Report and database.
Categorias:
Infrastructure
Foi atualizado:
23 abr 2017 ano
Indicadores de alterações dos valores ao longo dos anos
Mínimo:
11.135
1 jan 1961 ano
Máximo:
50.726
1 jan 2001 ano
Na data de observação
Valor
Mudança absoluta
A alteração em relação ao valor anterior
1 jan 1961 ano
11.135
+11.135
0.0%
1 jan 1966 ano
12.962
+1.827
16.41%
1 jan 1971 ano
16.526
+3.563
27.49%
1 jan 1976 ano
21.468
+4.942
29.91%
1 jan 1977 ano
22.453
+0.985
4.59%
1 jan 1978 ano
23.507
+1.054
4.69%
1 jan 1979 ano
24.665
+1.158
4.92%
1 jan 1980 ano
25.621
+0.956
3.88%
1 jan 1981 ano
26.707
+1.086
4.24%
1 jan 1982 ano
28.46
+1.753
6.56%
1 jan 1983 ano
29.261
+0.801
2.82%
1 jan 1984 ano
30.169
+0.908
3.1%
1 jan 1985 ano
31.064
+0.895
2.97%
1 jan 1986 ano
32.013
+0.95
3.06%
1 jan 1987 ano
32.91
+0.896
2.8%
1 jan 1988 ano
34.079
+1.17
3.55%
1 jan 1989 ano
35.398
+1.318
3.87%
1 jan 1990 ano
36.784
+1.386
3.92%
1 jan 1991 ano
38.284
+1.5
4.08%
1 jan 1992 ano
39.467
+1.183
3.09%
1 jan 1993 ano
40.626
+1.159
2.94%
1 jan 1994 ano
41.838
+1.213
2.98%
1 jan 1995 ano
43.157
+1.318
3.15%
1 jan 1996 ano
44.561
+1.404
3.25%
1 jan 1997 ano
45.955
+1.394
3.13%
1 jan 1998 ano
47.488
+1.532
3.33%
1 jan 1999 ano
48.227
+0.739
1.56%
1 jan 2000 ano
49.998
+1.771
3.67%
1 jan 2001 ano
50.726
+0.727
1.45%
1 jan 2002 ano
50.502
-0.224
-0.44%
1 jan 2003 ano
50.09
-0.412
-0.82%
1 jan 2004 ano
49.123
-0.967
-1.93%
1 jan 2005 ano
48.24
-0.882
-1.8%
1 jan 2006 ano
47.339
-0.901
-1.87%
1 jan 2007 ano
46.093
-1.246
-2.63%
1 jan 2008 ano
43.971
-2.122
-4.6%
1 jan 2009 ano
43.543
-0.428
-0.97%
1 jan 2010 ano
44.779
+1.236
2.84%
1 jan 2011 ano
43.944
-0.835
-1.86%
1 jan 2012 ano
42.696
-1.248
-2.84%
1 jan 2013 ano
41.559
-1.137
-2.66%
1 jan 2014 ano
40.132
-1.426
-3.43%
1 jan 2015 ano
39.05
-1.082
-2.7%
1 jan 2016 ano
37.989
-1.061
-2.72%
Classificação de países por estatísticas atuais por anos


Comentários: