29
/pt/
pt
AIzaSyAYiBZKx7MnpbEhh9jyipgxe19OcubqV5w
April 1, 2024
205241
Namibia
NAM
true
2
1
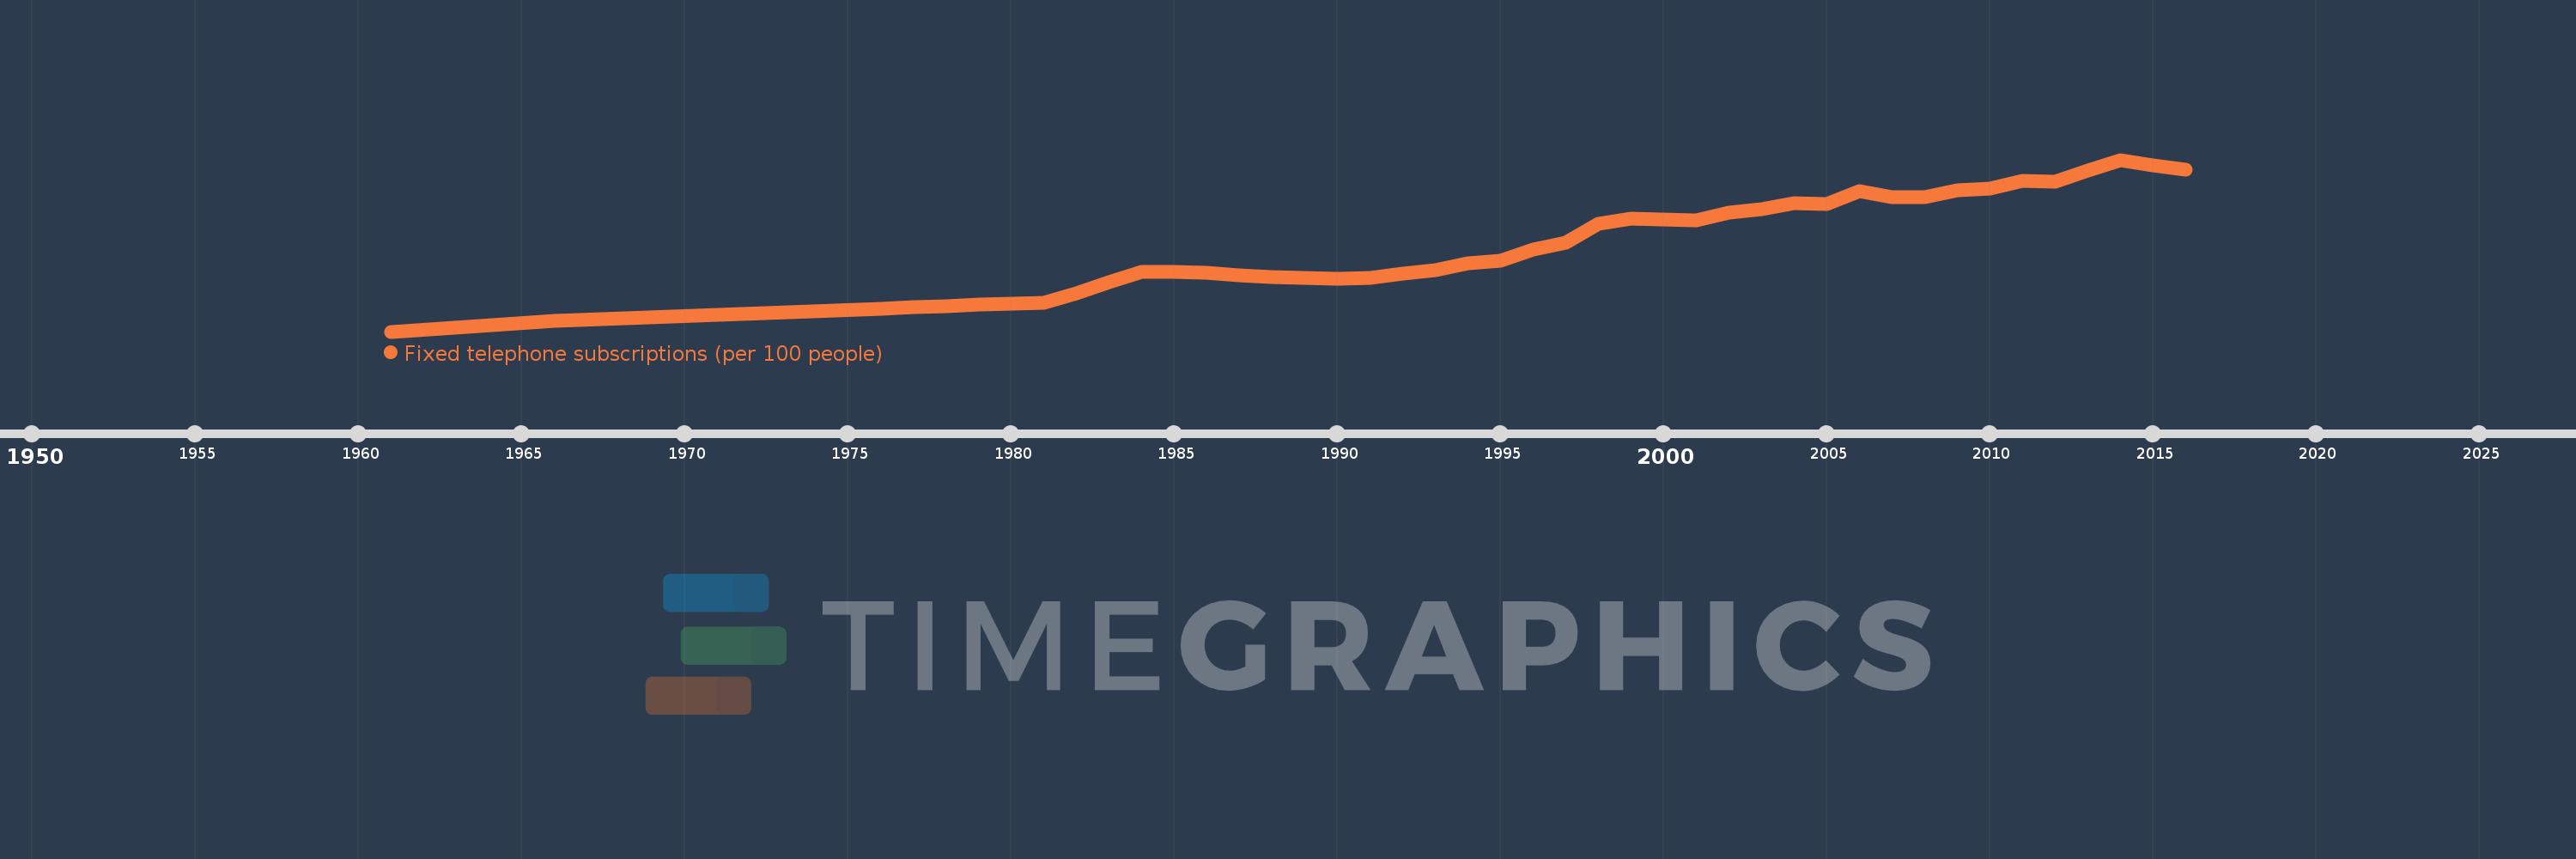
Fixed telephone subscriptions (per 100 people)
2016,2015,2014,2013,2012,2011,2010,2009,2008,2007,2006,2005,2004,2003,2002,2001,2000,1999,1998,1997,1996,1995,1994,1993,1992,1991,1990,1989,1988,1987,1986,1985,1984,1983,1982,1981,1980,1979,1978,1977,1976,1971,1966,1961
Estas estatísticas em outros países:
AfghanistanAlbaniaAlgeriaAmerican SamoaAndorraAngolaAntigua and BarbudaArab WorldArgentinaArmeniaArubaAustraliaAustriaAzerbaijanBahamas, TheBahrainBangladeshBarbadosBelarusBelgiumBelizeBeninBermudaBhutanBoliviaBosnia and HerzegovinaBotswanaBrazilBritish Virgin IslandsBrunei DarussalamBulgariaBurkina FasoBurundiCabo VerdeCambodiaCameroonCanadaCaribbean small statesCayman IslandsCentral African RepublicCentral Europe and the BalticsChadChileChinaColombiaComorosCongo, Dem. Rep.Congo, Rep.Costa RicaCote d'IvoireCroatiaCubaCuracaoCyprusCzech RepublicDenmarkDjiboutiDominicaDominican RepublicEarly-demographic dividendEast Asia & PacificEast Asia & Pacific (excluding high income)East Asia & Pacific (IDA & IBRD countries)EcuadorEgypt, Arab Rep.El SalvadorEquatorial GuineaEritreaEstoniaEthiopiaEuro areaEurope & Central AsiaEurope & Central Asia (excluding high income)Europe & Central Asia (IDA & IBRD countries)European UnionFaroe IslandsFijiFinlandFragile and conflict affected situationsFranceFrench PolynesiaGabonGambia, TheGeorgiaGermanyGhanaGibraltarGreeceGreenlandGrenadaGuamGuatemalaGuineaGuinea-BissauGuyanaHaitiHeavily indebted poor countries (HIPC)High incomeHondurasHong Kong SAR, ChinaHungaryIBRD onlyIcelandIDA & IBRD totalIDA blendIDA onlyIDA totalIndiaIndonesiaIran, Islamic Rep.IraqIrelandIsraelItalyJamaicaJapanJordanKazakhstanKenyaKiribatiKorea, Dem. People’s Rep.Korea, Rep.KosovoKuwaitKyrgyz RepublicLao PDRLate-demographic dividendLatin America & Caribbean Latin America & Caribbean (excluding high income)Latin America & the Caribbean (IDA & IBRD countries)LatviaLeast developed countries: UN classificationLebanonLesothoLiberiaLibyaLiechtensteinLithuaniaLow & middle incomeLow incomeLower middle incomeLuxembourgMacao SAR, ChinaMacedonia, FYRMadagascarMalawiMalaysiaMaldivesMaliMaltaMarshall IslandsMauritaniaMauritiusMexicoMicronesia, Fed. Sts.Middle East & North AfricaMiddle East & North Africa (excluding high income)Middle East & North Africa (IDA & IBRD countries)Middle incomeMoldovaMonacoMongoliaMontenegroMoroccoMozambiqueMyanmarNamibiaNauruNepalNetherlandsNew CaledoniaNew ZealandNicaraguaNigerNigeriaNorth AmericaNorthern Mariana IslandsNorwayOECD membersOmanOther small statesPacific island small statesPakistanPalauPanamaPapua New GuineaParaguayPeruPhilippinesPolandPortugalPost-demographic dividendPre-demographic dividendPuerto RicoQatarRomaniaRussian FederationRwandaSamoaSan MarinoSao Tome and PrincipeSaudi ArabiaSenegalSerbiaSeychellesSierra LeoneSingaporeSlovak RepublicSloveniaSmall statesSolomon IslandsSomaliaSouth AfricaSouth AsiaSouth Asia (IDA & IBRD)South SudanSpainSri LankaSt. Kitts and NevisSt. LuciaSt. Vincent and the GrenadinesSub-Saharan Africa Sub-Saharan Africa (excluding high income)Sub-Saharan Africa (IDA & IBRD countries)SudanSurinameSwazilandSwedenSwitzerlandSyrian Arab RepublicTajikistanTanzaniaThailandTimor-LesteTogoTongaTrinidad and TobagoTunisiaTurkeyTurkmenistanTurks and Caicos IslandsTuvaluUgandaUkraineUnited Arab EmiratesUnited KingdomUnited StatesUpper middle incomeUruguayUzbekistanVanuatuVenezuela, RBVietnamVirgin Islands (U.S.)West Bank and GazaWorldYemen, Rep.ZambiaZimbabwe Linha do tempo:
Nesta escala de tempo está apresentado um gráfico de 1961 ano até 2016 ano Namibia. Dados de 1960 ano ausente. O número de observações reais por data: 44.
Fonte (nome):
Indicadores de desenvolvimento mundial
Fonte (organização):
International Telecommunication Union, World Telecommunication/ICT Development Report and database.
Categorias:
Infrastructure
Foi atualizado:
23 abr 2017 ano
Indicadores de alterações dos valores ao longo dos anos
Mínimo:
1.826
1 jan 1961 ano
Máximo:
7.968
1 jan 2014 ano
Na data de observação
Valor
Mudança absoluta
A alteração em relação ao valor anterior
1 jan 1961 ano
1.826
+1.826
0.0%
1 jan 1966 ano
2.198
+0.372
20.38%
1 jan 1971 ano
2.435
+0.237
10.79%
1 jan 1976 ano
2.65
+0.215
8.84%
1 jan 1977 ano
2.693
+0.043
1.63%
1 jan 1978 ano
2.738
+0.044
1.64%
1 jan 1979 ano
2.782
+0.044
1.62%
1 jan 1980 ano
2.824
+0.043
1.53%
1 jan 1981 ano
2.863
+0.039
1.38%
1 jan 1982 ano
3.19
+0.327
11.41%
1 jan 1983 ano
3.596
+0.406
12.72%
1 jan 1984 ano
3.975
+0.379
10.54%
1 jan 1985 ano
3.957
-0.018
-0.46%
1 jan 1986 ano
3.915
-0.042
-1.05%
1 jan 1987 ano
3.85
-0.065
-1.66%
1 jan 1988 ano
3.768
-0.082
-2.12%
1 jan 1989 ano
3.74
-0.028
-0.75%
1 jan 1990 ano
3.723
-0.017
-0.46%
1 jan 1991 ano
3.744
+0.021
0.57%
1 jan 1992 ano
3.884
+0.139
3.72%
1 jan 1993 ano
4.028
+0.145
3.72%
1 jan 1994 ano
4.28
+0.252
6.26%
1 jan 1995 ano
4.346
+0.065
1.53%
1 jan 1996 ano
4.745
+0.4
9.2%
1 jan 1997 ano
5.017
+0.271
5.72%
1 jan 1998 ano
5.683
+0.666
13.28%
1 jan 1999 ano
5.85
+0.168
2.95%
1 jan 2000 ano
5.826
-0.025
-0.42%
1 jan 2001 ano
5.805
-0.021
-0.36%
1 jan 2002 ano
6.079
+0.274
4.72%
1 jan 2003 ano
6.2
+0.121
1.99%
1 jan 2004 ano
6.429
+0.229
3.7%
1 jan 2005 ano
6.386
-0.043
-0.67%
1 jan 2006 ano
6.857
+0.471
7.38%
1 jan 2007 ano
6.633
-0.225
-3.28%
1 jan 2008 ano
6.641
+0.008
0.12%
1 jan 2009 ano
6.887
+0.246
3.7%
1 jan 2010 ano
6.936
+0.049
0.72%
1 jan 2011 ano
7.208
+0.272
3.92%
1 jan 2012 ano
7.173
-0.036
-0.49%
1 jan 2013 ano
7.579
+0.407
5.67%
1 jan 2014 ano
7.968
+0.389
5.13%
1 jan 2015 ano
7.777
-0.192
-2.4%
1 jan 2016 ano
7.629
-0.148
-1.9%
Classificação de países por estatísticas atuais por anos


Comentários: