29
/pt/
pt
AIzaSyAYiBZKx7MnpbEhh9jyipgxe19OcubqV5w
April 1, 2024
215252
Oman
OMN
true
2
1
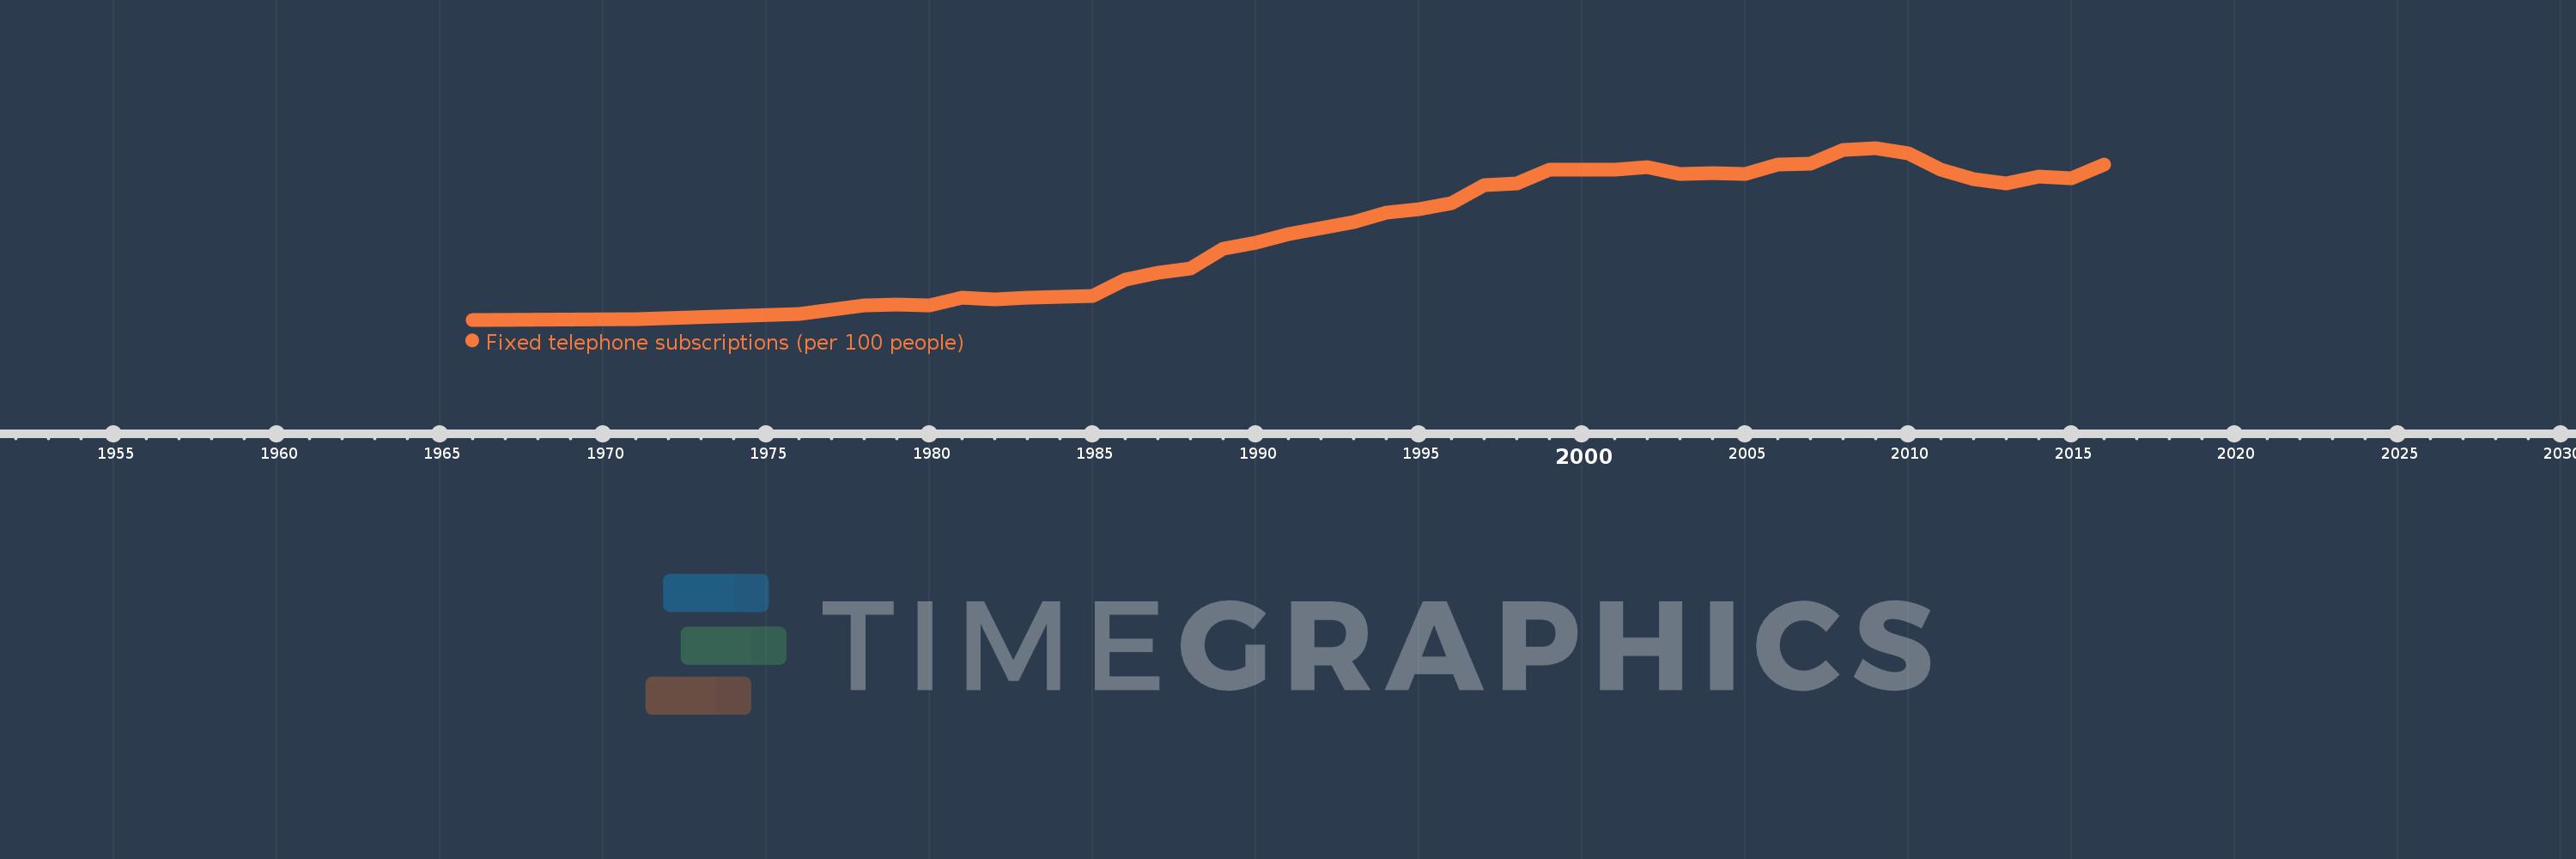
Fixed telephone subscriptions (per 100 people)
2016,2015,2014,2013,2012,2011,2010,2009,2008,2007,2006,2005,2004,2003,2002,2001,2000,1999,1998,1997,1996,1995,1994,1993,1992,1991,1990,1989,1988,1987,1986,1985,1984,1983,1982,1981,1980,1979,1978,1977,1976,1971,1966
Estas estatísticas em outros países:
AfghanistanAlbaniaAlgeriaAmerican SamoaAndorraAngolaAntigua and BarbudaArab WorldArgentinaArmeniaArubaAustraliaAustriaAzerbaijanBahamas, TheBahrainBangladeshBarbadosBelarusBelgiumBelizeBeninBermudaBhutanBoliviaBosnia and HerzegovinaBotswanaBrazilBritish Virgin IslandsBrunei DarussalamBulgariaBurkina FasoBurundiCabo VerdeCambodiaCameroonCanadaCaribbean small statesCayman IslandsCentral African RepublicCentral Europe and the BalticsChadChileChinaColombiaComorosCongo, Dem. Rep.Congo, Rep.Costa RicaCote d'IvoireCroatiaCubaCuracaoCyprusCzech RepublicDenmarkDjiboutiDominicaDominican RepublicEarly-demographic dividendEast Asia & PacificEast Asia & Pacific (excluding high income)East Asia & Pacific (IDA & IBRD countries)EcuadorEgypt, Arab Rep.El SalvadorEquatorial GuineaEritreaEstoniaEthiopiaEuro areaEurope & Central AsiaEurope & Central Asia (excluding high income)Europe & Central Asia (IDA & IBRD countries)European UnionFaroe IslandsFijiFinlandFragile and conflict affected situationsFranceFrench PolynesiaGabonGambia, TheGeorgiaGermanyGhanaGibraltarGreeceGreenlandGrenadaGuamGuatemalaGuineaGuinea-BissauGuyanaHaitiHeavily indebted poor countries (HIPC)High incomeHondurasHong Kong SAR, ChinaHungaryIBRD onlyIcelandIDA & IBRD totalIDA blendIDA onlyIDA totalIndiaIndonesiaIran, Islamic Rep.IraqIrelandIsraelItalyJamaicaJapanJordanKazakhstanKenyaKiribatiKorea, Dem. People’s Rep.Korea, Rep.KosovoKuwaitKyrgyz RepublicLao PDRLate-demographic dividendLatin America & Caribbean Latin America & Caribbean (excluding high income)Latin America & the Caribbean (IDA & IBRD countries)LatviaLeast developed countries: UN classificationLebanonLesothoLiberiaLibyaLiechtensteinLithuaniaLow & middle incomeLow incomeLower middle incomeLuxembourgMacao SAR, ChinaMacedonia, FYRMadagascarMalawiMalaysiaMaldivesMaliMaltaMarshall IslandsMauritaniaMauritiusMexicoMicronesia, Fed. Sts.Middle East & North AfricaMiddle East & North Africa (excluding high income)Middle East & North Africa (IDA & IBRD countries)Middle incomeMoldovaMonacoMongoliaMontenegroMoroccoMozambiqueMyanmarNamibiaNauruNepalNetherlandsNew CaledoniaNew ZealandNicaraguaNigerNigeriaNorth AmericaNorthern Mariana IslandsNorwayOECD membersOmanOther small statesPacific island small statesPakistanPalauPanamaPapua New GuineaParaguayPeruPhilippinesPolandPortugalPost-demographic dividendPre-demographic dividendPuerto RicoQatarRomaniaRussian FederationRwandaSamoaSan MarinoSao Tome and PrincipeSaudi ArabiaSenegalSerbiaSeychellesSierra LeoneSingaporeSlovak RepublicSloveniaSmall statesSolomon IslandsSomaliaSouth AfricaSouth AsiaSouth Asia (IDA & IBRD)South SudanSpainSri LankaSt. Kitts and NevisSt. LuciaSt. Vincent and the GrenadinesSub-Saharan Africa Sub-Saharan Africa (excluding high income)Sub-Saharan Africa (IDA & IBRD countries)SudanSurinameSwazilandSwedenSwitzerlandSyrian Arab RepublicTajikistanTanzaniaThailandTimor-LesteTogoTongaTrinidad and TobagoTunisiaTurkeyTurkmenistanTurks and Caicos IslandsTuvaluUgandaUkraineUnited Arab EmiratesUnited KingdomUnited StatesUpper middle incomeUruguayUzbekistanVanuatuVenezuela, RBVietnamVirgin Islands (U.S.)West Bank and GazaWorldYemen, Rep.ZambiaZimbabwe Linha do tempo:
Nesta escala de tempo está apresentado um gráfico de 1966 ano até 2016 ano Oman. Dados de 1965 ano ausente. O número de observações reais por data: 43.
Fonte (nome):
Indicadores de desenvolvimento mundial
Fonte (organização):
International Telecommunication Union, World Telecommunication/ICT Development Report and database.
Categorias:
Infrastructure
Foi atualizado:
23 abr 2017 ano
Indicadores de alterações dos valores ao longo dos anos
Mínimo:
0.032
1 jan 1966 ano
Máximo:
11.606
1 jan 2009 ano
Na data de observação
Valor
Mudança absoluta
A alteração em relação ao valor anterior
1 jan 1966 ano
0.032
+0.032
0.0%
1 jan 1971 ano
0.077
+0.045
140.47%
1 jan 1976 ano
0.42
+0.343
445.28%
1 jan 1977 ano
0.717
+0.297
70.86%
1 jan 1978 ano
0.992
+0.275
38.36%
1 jan 1979 ano
1.076
+0.084
8.47%
1 jan 1980 ano
1.022
-0.054
-4.98%
1 jan 1981 ano
1.497
+0.475
46.46%
1 jan 1982 ano
1.416
-0.081
-5.42%
1 jan 1983 ano
1.523
+0.107
7.52%
1 jan 1984 ano
1.571
+0.048
3.14%
1 jan 1985 ano
1.635
+0.064
4.1%
1 jan 1986 ano
2.758
+1.123
68.66%
1 jan 1987 ano
3.173
+0.415
15.06%
1 jan 1988 ano
3.508
+0.335
10.55%
1 jan 1989 ano
4.837
+1.33
37.91%
1 jan 1990 ano
5.248
+0.41
8.48%
1 jan 1991 ano
5.783
+0.536
10.2%
1 jan 1992 ano
6.183
+0.4
6.92%
1 jan 1993 ano
6.619
+0.436
7.05%
1 jan 1994 ano
7.23
+0.611
9.23%
1 jan 1995 ano
7.483
+0.253
3.5%
1 jan 1996 ano
7.887
+0.404
5.4%
1 jan 1997 ano
9.085
+1.198
15.18%
1 jan 1998 ano
9.209
+0.125
1.37%
1 jan 1999 ano
10.131
+0.921
10.01%
1 jan 2000 ano
10.145
+0.014
0.14%
1 jan 2001 ano
10.116
-0.028
-0.28%
1 jan 2002 ano
10.295
+0.179
1.76%
1 jan 2003 ano
9.861
-0.434
-4.22%
1 jan 2004 ano
9.886
+0.025
0.25%
1 jan 2005 ano
9.852
-0.034
-0.34%
1 jan 2006 ano
10.516
+0.664
6.74%
1 jan 2007 ano
10.556
+0.041
0.39%
1 jan 2008 ano
11.477
+0.921
8.72%
1 jan 2009 ano
11.606
+0.13
1.13%
1 jan 2010 ano
11.27
-0.336
-2.9%
1 jan 2011 ano
10.131
-1.139
-10.11%
1 jan 2012 ano
9.499
-0.632
-6.24%
1 jan 2013 ano
9.19
-0.309
-3.26%
1 jan 2014 ano
9.674
+0.485
5.27%
1 jan 2015 ano
9.556
-0.119
-1.23%
1 jan 2016 ano
10.461
+0.905
9.47%
Classificação de países por estatísticas atuais por anos


Comentários: