29
/pt/
pt
AIzaSyAYiBZKx7MnpbEhh9jyipgxe19OcubqV5w
April 1, 2024
25677
Central Europe and the Baltics
CEB
false
2
1
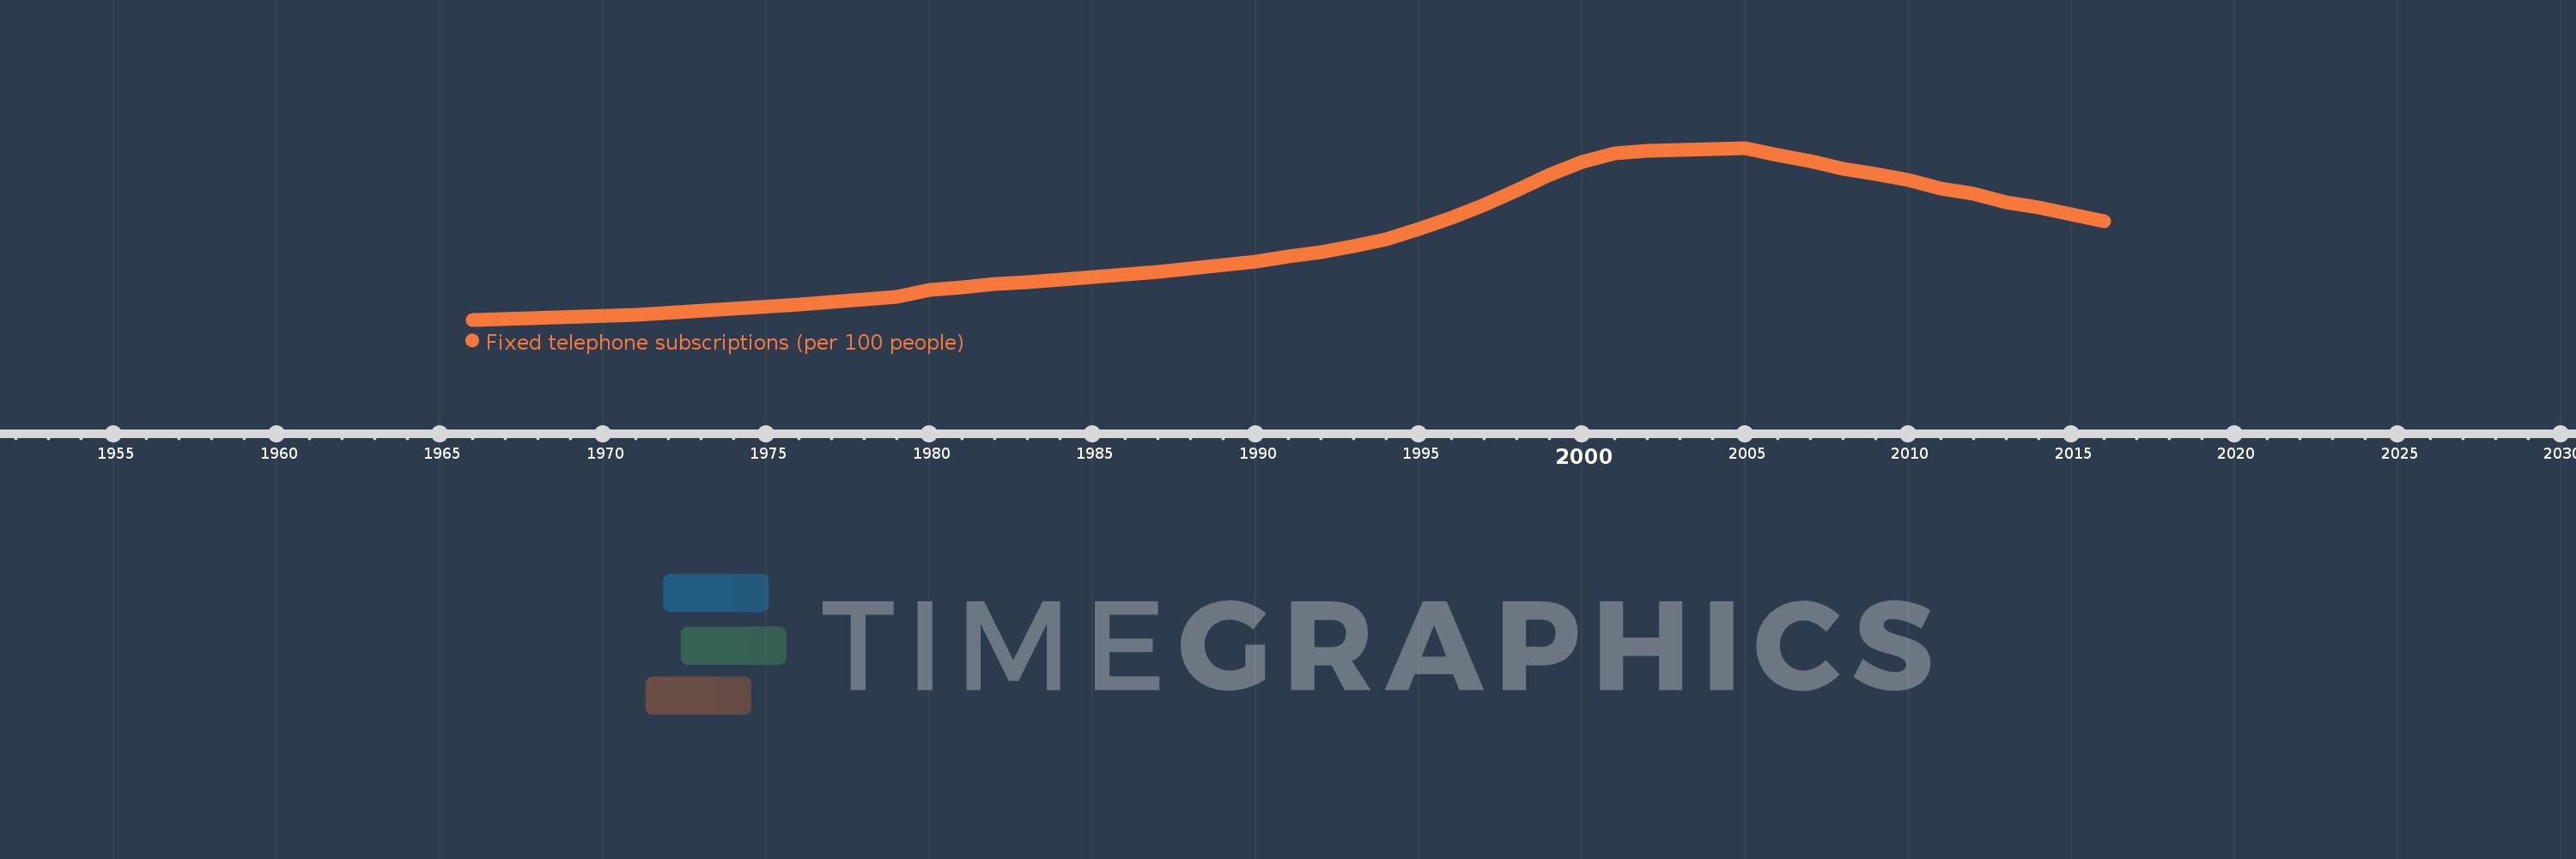
Fixed telephone subscriptions (per 100 people)
2016,2015,2014,2013,2012,2011,2010,2009,2008,2007,2006,2005,2004,2003,2002,2001,2000,1999,1998,1997,1996,1995,1994,1993,1992,1991,1990,1989,1988,1987,1986,1985,1984,1983,1982,1981,1980,1979,1978,1977,1976,1971,1966
Estas estatísticas em outros países:
AfghanistanAlbaniaAlgeriaAmerican SamoaAndorraAngolaAntigua and BarbudaArab WorldArgentinaArmeniaArubaAustraliaAustriaAzerbaijanBahamas, TheBahrainBangladeshBarbadosBelarusBelgiumBelizeBeninBermudaBhutanBoliviaBosnia and HerzegovinaBotswanaBrazilBritish Virgin IslandsBrunei DarussalamBulgariaBurkina FasoBurundiCabo VerdeCambodiaCameroonCanadaCaribbean small statesCayman IslandsCentral African RepublicCentral Europe and the BalticsChadChileChinaColombiaComorosCongo, Dem. Rep.Congo, Rep.Costa RicaCote d'IvoireCroatiaCubaCuracaoCyprusCzech RepublicDenmarkDjiboutiDominicaDominican RepublicEarly-demographic dividendEast Asia & PacificEast Asia & Pacific (excluding high income)East Asia & Pacific (IDA & IBRD countries)EcuadorEgypt, Arab Rep.El SalvadorEquatorial GuineaEritreaEstoniaEthiopiaEuro areaEurope & Central AsiaEurope & Central Asia (excluding high income)Europe & Central Asia (IDA & IBRD countries)European UnionFaroe IslandsFijiFinlandFragile and conflict affected situationsFranceFrench PolynesiaGabonGambia, TheGeorgiaGermanyGhanaGibraltarGreeceGreenlandGrenadaGuamGuatemalaGuineaGuinea-BissauGuyanaHaitiHeavily indebted poor countries (HIPC)High incomeHondurasHong Kong SAR, ChinaHungaryIBRD onlyIcelandIDA & IBRD totalIDA blendIDA onlyIDA totalIndiaIndonesiaIran, Islamic Rep.IraqIrelandIsraelItalyJamaicaJapanJordanKazakhstanKenyaKiribatiKorea, Dem. People’s Rep.Korea, Rep.KosovoKuwaitKyrgyz RepublicLao PDRLate-demographic dividendLatin America & Caribbean Latin America & Caribbean (excluding high income)Latin America & the Caribbean (IDA & IBRD countries)LatviaLeast developed countries: UN classificationLebanonLesothoLiberiaLibyaLiechtensteinLithuaniaLow & middle incomeLow incomeLower middle incomeLuxembourgMacao SAR, ChinaMacedonia, FYRMadagascarMalawiMalaysiaMaldivesMaliMaltaMarshall IslandsMauritaniaMauritiusMexicoMicronesia, Fed. Sts.Middle East & North AfricaMiddle East & North Africa (excluding high income)Middle East & North Africa (IDA & IBRD countries)Middle incomeMoldovaMonacoMongoliaMontenegroMoroccoMozambiqueMyanmarNamibiaNauruNepalNetherlandsNew CaledoniaNew ZealandNicaraguaNigerNigeriaNorth AmericaNorthern Mariana IslandsNorwayOECD membersOmanOther small statesPacific island small statesPakistanPalauPanamaPapua New GuineaParaguayPeruPhilippinesPolandPortugalPost-demographic dividendPre-demographic dividendPuerto RicoQatarRomaniaRussian FederationRwandaSamoaSan MarinoSao Tome and PrincipeSaudi ArabiaSenegalSerbiaSeychellesSierra LeoneSingaporeSlovak RepublicSloveniaSmall statesSolomon IslandsSomaliaSouth AfricaSouth AsiaSouth Asia (IDA & IBRD)South SudanSpainSri LankaSt. Kitts and NevisSt. LuciaSt. Vincent and the GrenadinesSub-Saharan Africa Sub-Saharan Africa (excluding high income)Sub-Saharan Africa (IDA & IBRD countries)SudanSurinameSwazilandSwedenSwitzerlandSyrian Arab RepublicTajikistanTanzaniaThailandTimor-LesteTogoTongaTrinidad and TobagoTunisiaTurkeyTurkmenistanTurks and Caicos IslandsTuvaluUgandaUkraineUnited Arab EmiratesUnited KingdomUnited StatesUpper middle incomeUruguayUzbekistanVanuatuVenezuela, RBVietnamVirgin Islands (U.S.)West Bank and GazaWorldYemen, Rep.ZambiaZimbabwe Linha do tempo:
Nesta escala de tempo está apresentado um gráfico de 1966 ano até 2016 ano Central Europe and the Baltics. Dados de 1965 ano ausente. O número de observações reais por data: 43.
Fonte (nome):
Indicadores de desenvolvimento mundial
Fonte (organização):
International Telecommunication Union, World Telecommunication/ICT Development Report and database.
Categorias:
Infrastructure
Foi atualizado:
23 abr 2017 ano
Indicadores de alterações dos valores ao longo dos anos
Mínimo:
2.391
1 jan 1966 ano
Máximo:
30.522
1 jan 2005 ano
Na data de observação
Valor
Mudança absoluta
A alteração em relação ao valor anterior
1 jan 1966 ano
2.391
+2.391
0.0%
1 jan 1971 ano
3.257
+0.866
36.2%
1 jan 1976 ano
4.84
+1.583
48.6%
1 jan 1977 ano
5.322
+0.482
9.96%
1 jan 1978 ano
5.767
+0.445
8.36%
1 jan 1979 ano
6.182
+0.415
7.2%
1 jan 1980 ano
7.292
+1.11
17.96%
1 jan 1981 ano
7.731
+0.439
6.02%
1 jan 1982 ano
8.257
+0.526
6.81%
1 jan 1983 ano
8.468
+0.211
2.56%
1 jan 1984 ano
8.954
+0.485
5.73%
1 jan 1985 ano
9.345
+0.392
4.37%
1 jan 1986 ano
9.847
+0.501
5.37%
1 jan 1987 ano
10.256
+0.41
4.16%
1 jan 1988 ano
10.791
+0.534
5.21%
1 jan 1989 ano
11.361
+0.571
5.29%
1 jan 1990 ano
11.932
+0.571
5.03%
1 jan 1991 ano
12.724
+0.791
6.63%
1 jan 1992 ano
13.462
+0.738
5.8%
1 jan 1993 ano
14.474
+1.013
7.52%
1 jan 1994 ano
15.583
+1.109
7.66%
1 jan 1995 ano
17.192
+1.608
10.32%
1 jan 1996 ano
19.02
+1.828
10.63%
1 jan 1997 ano
21.225
+2.205
11.59%
1 jan 1998 ano
23.602
+2.377
11.2%
1 jan 1999 ano
26.15
+2.548
10.8%
1 jan 2000 ano
28.28
+2.13
8.14%
1 jan 2001 ano
29.589
+1.31
4.63%
1 jan 2002 ano
30.122
+0.533
1.8%
1 jan 2003 ano
30.129
+0.006
0.02%
1 jan 2004 ano
30.342
+0.214
0.71%
1 jan 2005 ano
30.522
+0.179
0.59%
1 jan 2006 ano
29.374
-1.148
-3.76%
1 jan 2007 ano
28.331
-1.043
-3.55%
1 jan 2008 ano
27.16
-1.171
-4.13%
1 jan 2009 ano
26.275
-0.885
-3.26%
1 jan 2010 ano
25.228
-1.047
-3.99%
1 jan 2011 ano
23.818
-1.409
-5.59%
1 jan 2012 ano
23.004
-0.815
-3.42%
1 jan 2013 ano
21.649
-1.355
-5.89%
1 jan 2014 ano
20.789
-0.86
-3.97%
1 jan 2015 ano
19.713
-1.076
-5.17%
1 jan 2016 ano
18.594
-1.119
-5.68%
Classificação de países por estatísticas atuais por anos


Comentários: