29
/pt/
pt
AIzaSyAYiBZKx7MnpbEhh9jyipgxe19OcubqV5w
April 1, 2024
257281
Switzerland
CHE
true
2
1
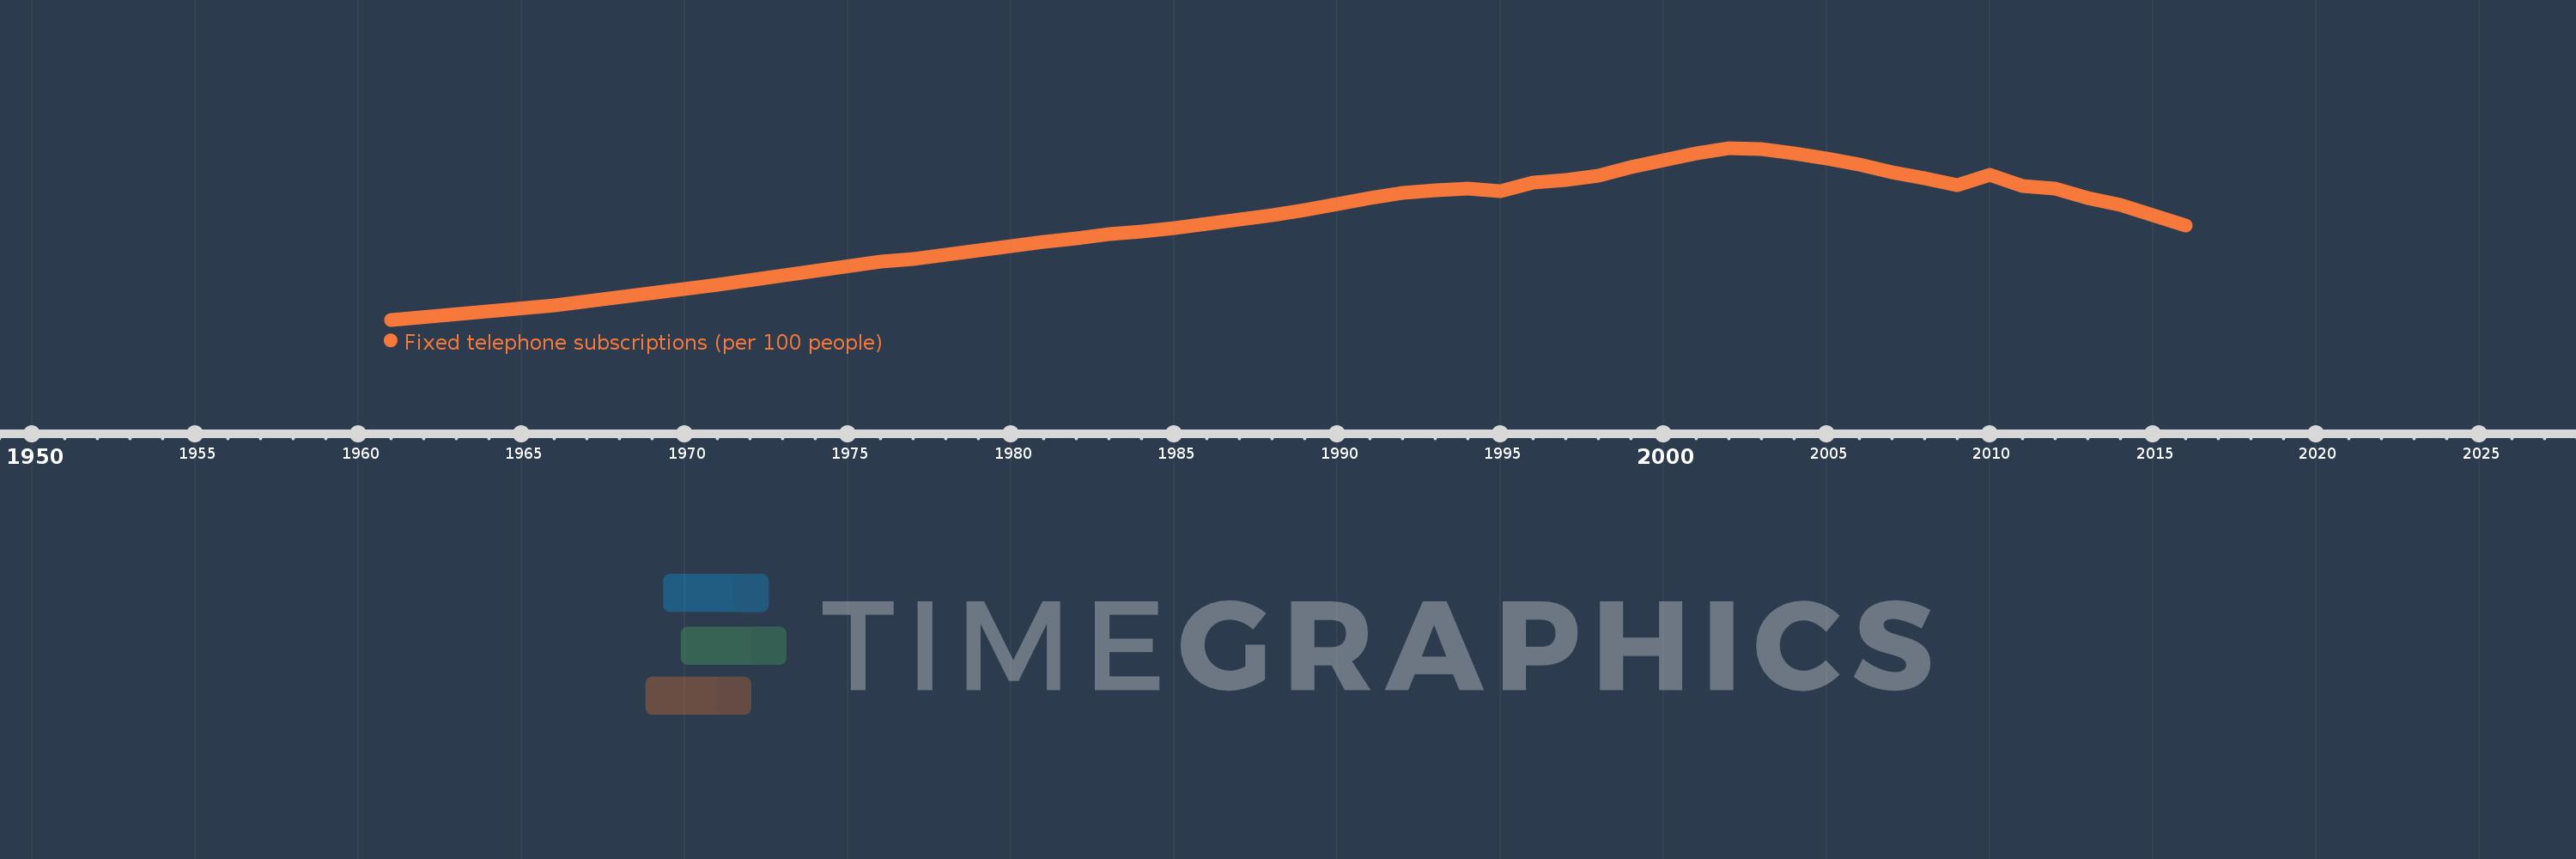
Fixed telephone subscriptions (per 100 people)
2016,2015,2014,2013,2012,2011,2010,2009,2008,2007,2006,2005,2004,2003,2002,2001,2000,1999,1998,1997,1996,1995,1994,1993,1992,1991,1990,1989,1988,1987,1986,1985,1984,1983,1982,1981,1980,1979,1978,1977,1976,1971,1966,1961
Estas estatísticas em outros países:
AfghanistanAlbaniaAlgeriaAmerican SamoaAndorraAngolaAntigua and BarbudaArab WorldArgentinaArmeniaArubaAustraliaAustriaAzerbaijanBahamas, TheBahrainBangladeshBarbadosBelarusBelgiumBelizeBeninBermudaBhutanBoliviaBosnia and HerzegovinaBotswanaBrazilBritish Virgin IslandsBrunei DarussalamBulgariaBurkina FasoBurundiCabo VerdeCambodiaCameroonCanadaCaribbean small statesCayman IslandsCentral African RepublicCentral Europe and the BalticsChadChileChinaColombiaComorosCongo, Dem. Rep.Congo, Rep.Costa RicaCote d'IvoireCroatiaCubaCuracaoCyprusCzech RepublicDenmarkDjiboutiDominicaDominican RepublicEarly-demographic dividendEast Asia & PacificEast Asia & Pacific (excluding high income)East Asia & Pacific (IDA & IBRD countries)EcuadorEgypt, Arab Rep.El SalvadorEquatorial GuineaEritreaEstoniaEthiopiaEuro areaEurope & Central AsiaEurope & Central Asia (excluding high income)Europe & Central Asia (IDA & IBRD countries)European UnionFaroe IslandsFijiFinlandFragile and conflict affected situationsFranceFrench PolynesiaGabonGambia, TheGeorgiaGermanyGhanaGibraltarGreeceGreenlandGrenadaGuamGuatemalaGuineaGuinea-BissauGuyanaHaitiHeavily indebted poor countries (HIPC)High incomeHondurasHong Kong SAR, ChinaHungaryIBRD onlyIcelandIDA & IBRD totalIDA blendIDA onlyIDA totalIndiaIndonesiaIran, Islamic Rep.IraqIrelandIsraelItalyJamaicaJapanJordanKazakhstanKenyaKiribatiKorea, Dem. People’s Rep.Korea, Rep.KosovoKuwaitKyrgyz RepublicLao PDRLate-demographic dividendLatin America & Caribbean Latin America & Caribbean (excluding high income)Latin America & the Caribbean (IDA & IBRD countries)LatviaLeast developed countries: UN classificationLebanonLesothoLiberiaLibyaLiechtensteinLithuaniaLow & middle incomeLow incomeLower middle incomeLuxembourgMacao SAR, ChinaMacedonia, FYRMadagascarMalawiMalaysiaMaldivesMaliMaltaMarshall IslandsMauritaniaMauritiusMexicoMicronesia, Fed. Sts.Middle East & North AfricaMiddle East & North Africa (excluding high income)Middle East & North Africa (IDA & IBRD countries)Middle incomeMoldovaMonacoMongoliaMontenegroMoroccoMozambiqueMyanmarNamibiaNauruNepalNetherlandsNew CaledoniaNew ZealandNicaraguaNigerNigeriaNorth AmericaNorthern Mariana IslandsNorwayOECD membersOmanOther small statesPacific island small statesPakistanPalauPanamaPapua New GuineaParaguayPeruPhilippinesPolandPortugalPost-demographic dividendPre-demographic dividendPuerto RicoQatarRomaniaRussian FederationRwandaSamoaSan MarinoSao Tome and PrincipeSaudi ArabiaSenegalSerbiaSeychellesSierra LeoneSingaporeSlovak RepublicSloveniaSmall statesSolomon IslandsSomaliaSouth AfricaSouth AsiaSouth Asia (IDA & IBRD)South SudanSpainSri LankaSt. Kitts and NevisSt. LuciaSt. Vincent and the GrenadinesSub-Saharan Africa Sub-Saharan Africa (excluding high income)Sub-Saharan Africa (IDA & IBRD countries)SudanSurinameSwazilandSwedenSwitzerlandSyrian Arab RepublicTajikistanTanzaniaThailandTimor-LesteTogoTongaTrinidad and TobagoTunisiaTurkeyTurkmenistanTurks and Caicos IslandsTuvaluUgandaUkraineUnited Arab EmiratesUnited KingdomUnited StatesUpper middle incomeUruguayUzbekistanVanuatuVenezuela, RBVietnamVirgin Islands (U.S.)West Bank and GazaWorldYemen, Rep.ZambiaZimbabwe Linha do tempo:
Nesta escala de tempo está apresentado um gráfico de 1961 ano até 2016 ano Switzerland. Dados de 1960 ano ausente. O número de observações reais por data: 44.
Fonte (nome):
Indicadores de desenvolvimento mundial
Fonte (organização):
International Telecommunication Union, World Telecommunication/ICT Development Report and database.
Categorias:
Infrastructure
Foi atualizado:
23 abr 2017 ano
Indicadores de alterações dos valores ao longo dos anos
Mínimo:
20.6
1 jan 1961 ano
Máximo:
74.762
1 jan 2002 ano
Na data de observação
Valor
Mudança absoluta
A alteração em relação ao valor anterior
1 jan 1961 ano
20.6
+20.6
0.0%
1 jan 1966 ano
25.146
+4.546
22.07%
1 jan 1971 ano
31.527
+6.381
25.38%
1 jan 1976 ano
38.86
+7.333
23.26%
1 jan 1977 ano
39.699
+0.84
2.16%
1 jan 1978 ano
40.986
+1.286
3.24%
1 jan 1979 ano
42.347
+1.361
3.32%
1 jan 1980 ano
43.685
+1.338
3.16%
1 jan 1981 ano
45.038
+1.353
3.1%
1 jan 1982 ano
46.312
+1.275
2.83%
1 jan 1983 ano
47.466
+1.154
2.49%
1 jan 1984 ano
48.536
+1.07
2.25%
1 jan 1985 ano
49.63
+1.094
2.25%
1 jan 1986 ano
50.762
+1.132
2.28%
1 jan 1987 ano
52.075
+1.314
2.59%
1 jan 1988 ano
53.583
+1.508
2.9%
1 jan 1989 ano
55.281
+1.698
3.17%
1 jan 1990 ano
57.183
+1.902
3.44%
1 jan 1991 ano
59.076
+1.894
3.31%
1 jan 1992 ano
60.544
+1.468
2.48%
1 jan 1993 ano
61.414
+0.87
1.44%
1 jan 1994 ano
61.91
+0.497
0.81%
1 jan 1995 ano
61.174
-0.737
-1.19%
1 jan 1996 ano
63.845
+2.671
4.37%
1 jan 1997 ano
64.748
+0.904
1.42%
1 jan 1998 ano
66.12
+1.371
2.12%
1 jan 1999 ano
68.658
+2.538
3.84%
1 jan 2000 ano
70.984
+2.326
3.39%
1 jan 2001 ano
73.068
+2.084
2.94%
1 jan 2002 ano
74.762
+1.695
2.32%
1 jan 2003 ano
74.398
-0.364
-0.49%
1 jan 2004 ano
73.033
-1.365
-1.83%
1 jan 2005 ano
71.528
-1.505
-2.06%
1 jan 2006 ano
69.51
-2.018
-2.82%
1 jan 2007 ano
67.116
-2.394
-3.44%
1 jan 2008 ano
65.134
-1.982
-2.95%
1 jan 2009 ano
63.084
-2.049
-3.15%
1 jan 2010 ano
66.279
+3.194
5.06%
1 jan 2011 ano
62.675
-3.604
-5.44%
1 jan 2012 ano
61.891
-0.784
-1.25%
1 jan 2013 ano
59.044
-2.847
-4.6%
1 jan 2014 ano
56.863
-2.181
-3.69%
1 jan 2015 ano
53.625
-3.238
-5.69%
1 jan 2016 ano
50.251
-3.374
-6.29%
Classificação de países por estatísticas atuais por anos


Comentários: