29
/pt/
pt
AIzaSyAYiBZKx7MnpbEhh9jyipgxe19OcubqV5w
April 1, 2024
105959
China
CHN
true
2
1
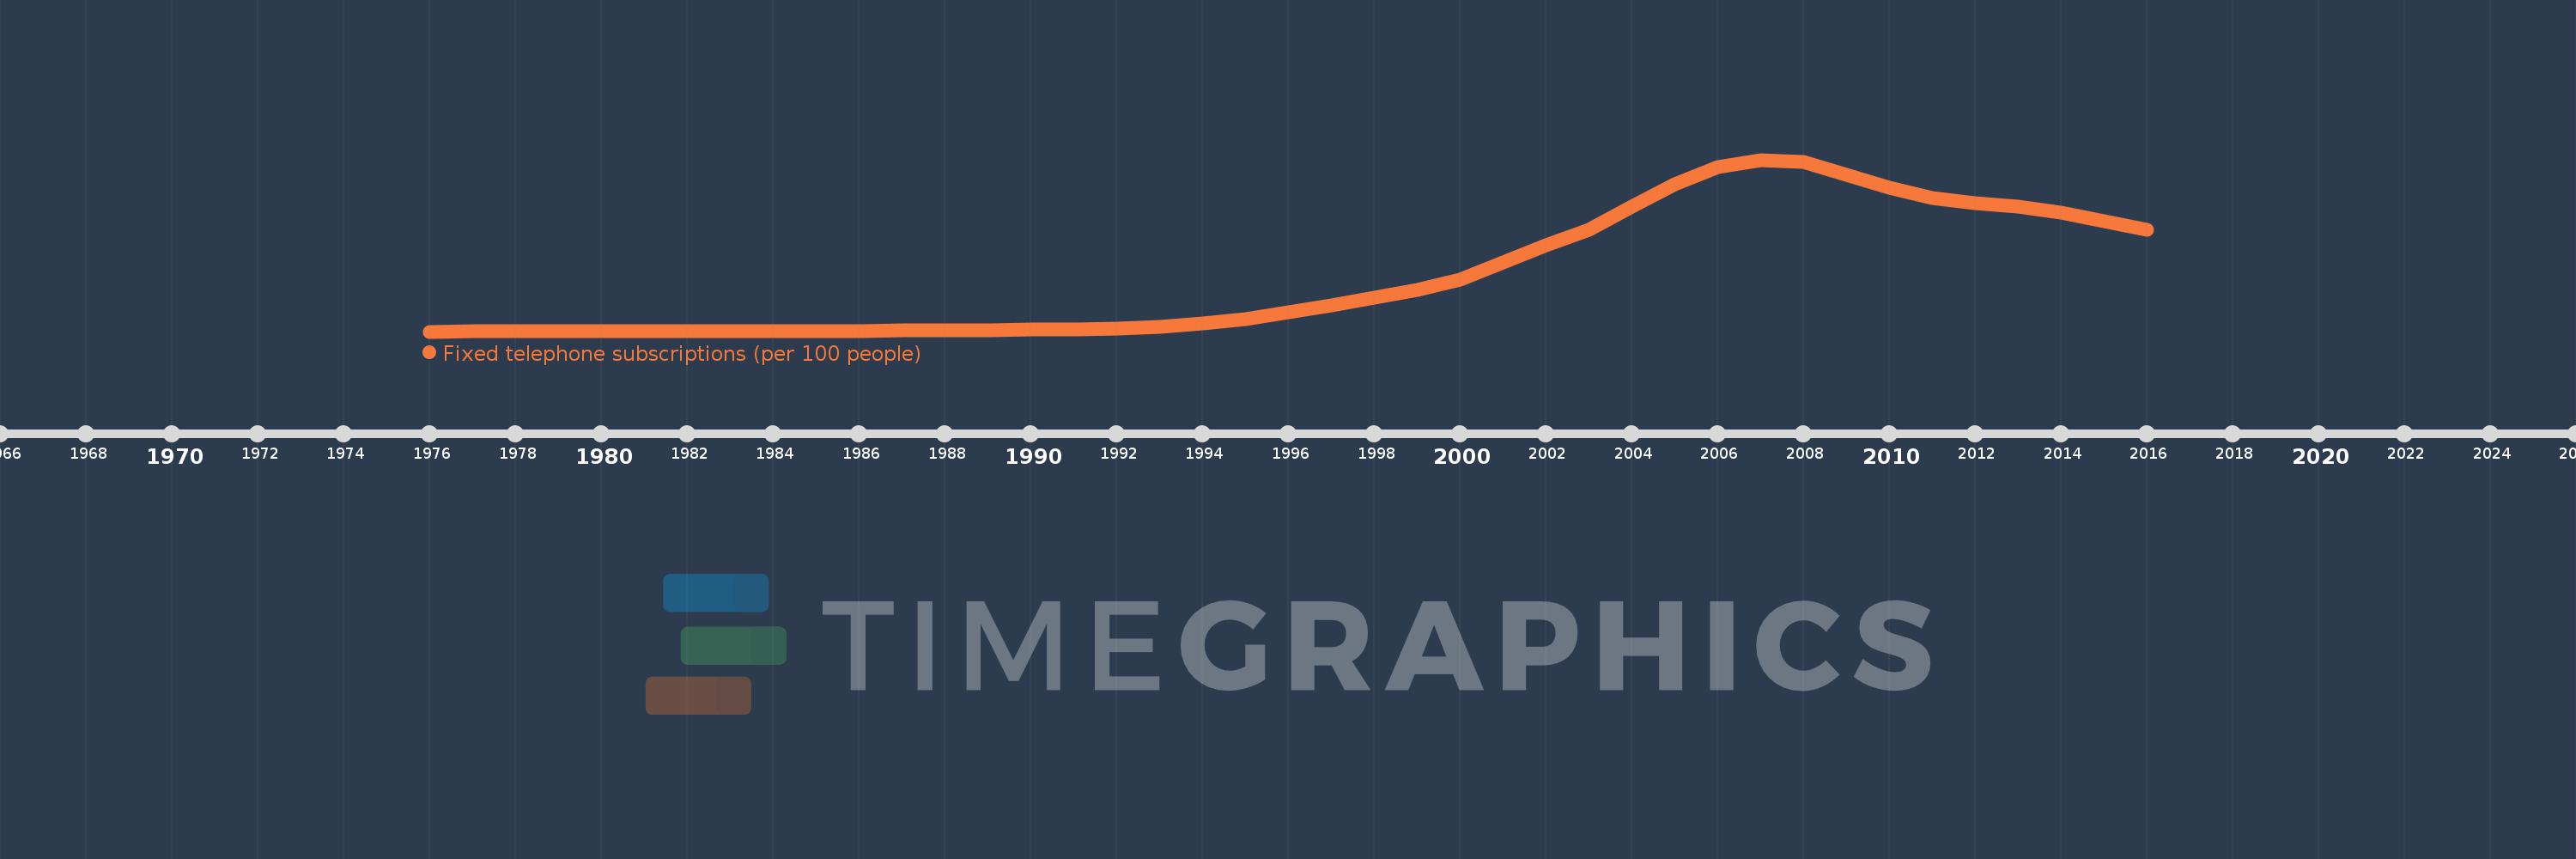
Fixed telephone subscriptions (per 100 people)
2016,2015,2014,2013,2012,2011,2010,2009,2008,2007,2006,2005,2004,2003,2002,2001,2000,1999,1998,1997,1996,1995,1994,1993,1992,1991,1990,1989,1988,1987,1986,1985,1984,1983,1982,1981,1980,1979,1978,1977,1976
Estas estatísticas em outros países:
AfghanistanAlbaniaAlgeriaAmerican SamoaAndorraAngolaAntigua and BarbudaArab WorldArgentinaArmeniaArubaAustraliaAustriaAzerbaijanBahamas, TheBahrainBangladeshBarbadosBelarusBelgiumBelizeBeninBermudaBhutanBoliviaBosnia and HerzegovinaBotswanaBrazilBritish Virgin IslandsBrunei DarussalamBulgariaBurkina FasoBurundiCabo VerdeCambodiaCameroonCanadaCaribbean small statesCayman IslandsCentral African RepublicCentral Europe and the BalticsChadChileChinaColombiaComorosCongo, Dem. Rep.Congo, Rep.Costa RicaCote d'IvoireCroatiaCubaCuracaoCyprusCzech RepublicDenmarkDjiboutiDominicaDominican RepublicEarly-demographic dividendEast Asia & PacificEast Asia & Pacific (excluding high income)East Asia & Pacific (IDA & IBRD countries)EcuadorEgypt, Arab Rep.El SalvadorEquatorial GuineaEritreaEstoniaEthiopiaEuro areaEurope & Central AsiaEurope & Central Asia (excluding high income)Europe & Central Asia (IDA & IBRD countries)European UnionFaroe IslandsFijiFinlandFragile and conflict affected situationsFranceFrench PolynesiaGabonGambia, TheGeorgiaGermanyGhanaGibraltarGreeceGreenlandGrenadaGuamGuatemalaGuineaGuinea-BissauGuyanaHaitiHeavily indebted poor countries (HIPC)High incomeHondurasHong Kong SAR, ChinaHungaryIBRD onlyIcelandIDA & IBRD totalIDA blendIDA onlyIDA totalIndiaIndonesiaIran, Islamic Rep.IraqIrelandIsraelItalyJamaicaJapanJordanKazakhstanKenyaKiribatiKorea, Dem. People’s Rep.Korea, Rep.KosovoKuwaitKyrgyz RepublicLao PDRLate-demographic dividendLatin America & Caribbean Latin America & Caribbean (excluding high income)Latin America & the Caribbean (IDA & IBRD countries)LatviaLeast developed countries: UN classificationLebanonLesothoLiberiaLibyaLiechtensteinLithuaniaLow & middle incomeLow incomeLower middle incomeLuxembourgMacao SAR, ChinaMacedonia, FYRMadagascarMalawiMalaysiaMaldivesMaliMaltaMarshall IslandsMauritaniaMauritiusMexicoMicronesia, Fed. Sts.Middle East & North AfricaMiddle East & North Africa (excluding high income)Middle East & North Africa (IDA & IBRD countries)Middle incomeMoldovaMonacoMongoliaMontenegroMoroccoMozambiqueMyanmarNamibiaNauruNepalNetherlandsNew CaledoniaNew ZealandNicaraguaNigerNigeriaNorth AmericaNorthern Mariana IslandsNorwayOECD membersOmanOther small statesPacific island small statesPakistanPalauPanamaPapua New GuineaParaguayPeruPhilippinesPolandPortugalPost-demographic dividendPre-demographic dividendPuerto RicoQatarRomaniaRussian FederationRwandaSamoaSan MarinoSao Tome and PrincipeSaudi ArabiaSenegalSerbiaSeychellesSierra LeoneSingaporeSlovak RepublicSloveniaSmall statesSolomon IslandsSomaliaSouth AfricaSouth AsiaSouth Asia (IDA & IBRD)South SudanSpainSri LankaSt. Kitts and NevisSt. LuciaSt. Vincent and the GrenadinesSub-Saharan Africa Sub-Saharan Africa (excluding high income)Sub-Saharan Africa (IDA & IBRD countries)SudanSurinameSwazilandSwedenSwitzerlandSyrian Arab RepublicTajikistanTanzaniaThailandTimor-LesteTogoTongaTrinidad and TobagoTunisiaTurkeyTurkmenistanTurks and Caicos IslandsTuvaluUgandaUkraineUnited Arab EmiratesUnited KingdomUnited StatesUpper middle incomeUruguayUzbekistanVanuatuVenezuela, RBVietnamVirgin Islands (U.S.)West Bank and GazaWorldYemen, Rep.ZambiaZimbabwe Linha do tempo:
Nesta escala de tempo está apresentado um gráfico de 1976 ano até 2016 ano China. Dados de 1975 ano ausente. O número de observações reais por data: 41.
Fonte (nome):
Indicadores de desenvolvimento mundial
Fonte (organização):
International Telecommunication Union, World Telecommunication/ICT Development Report and database.
Categorias:
Infrastructure
Foi atualizado:
23 abr 2017 ano
Indicadores de alterações dos valores ao longo dos anos
Mínimo:
0.185
1 jan 1976 ano
Máximo:
27.733
1 jan 2007 ano
Na data de observação
Valor
Mudança absoluta
A alteração em relação ao valor anterior
1 jan 1976 ano
0.185
+0.185
0.0%
1 jan 1977 ano
0.189
+0.004
2.3%
1 jan 1978 ano
0.194
+0.005
2.5%
1 jan 1979 ano
0.201
+0.007
3.55%
1 jan 1980 ano
0.209
+0.008
4.17%
1 jan 1981 ano
0.218
+0.008
3.84%
1 jan 1982 ano
0.223
+0.005
2.28%
1 jan 1983 ano
0.231
+0.009
3.97%
1 jan 1984 ano
0.244
+0.013
5.48%
1 jan 1985 ano
0.266
+0.022
8.86%
1 jan 1986 ano
0.294
+0.028
10.57%
1 jan 1987 ano
0.324
+0.03
10.26%
1 jan 1988 ano
0.354
+0.03
9.36%
1 jan 1989 ano
0.42
+0.066
18.65%
1 jan 1990 ano
0.496
+0.075
17.96%
1 jan 1991 ano
0.588
+0.092
18.58%
1 jan 1992 ano
0.714
+0.127
21.53%
1 jan 1993 ano
0.957
+0.242
33.92%
1 jan 1994 ano
1.429
+0.472
49.35%
1 jan 1995 ano
2.227
+0.798
55.84%
1 jan 1996 ano
3.289
+1.063
47.73%
1 jan 1997 ano
4.403
+1.114
33.86%
1 jan 1998 ano
5.593
+1.19
27.03%
1 jan 1999 ano
6.91
+1.316
23.53%
1 jan 2000 ano
8.541
+1.631
23.61%
1 jan 2001 ano
11.311
+2.77
32.44%
1 jan 2002 ano
14.005
+2.694
23.82%
1 jan 2003 ano
16.538
+2.533
18.09%
1 jan 2004 ano
20.168
+3.63
21.95%
1 jan 2005 ano
23.791
+3.623
17.96%
1 jan 2006 ano
26.586
+2.795
11.75%
1 jan 2007 ano
27.733
+1.148
4.32%
1 jan 2008 ano
27.402
-0.331
-1.2%
1 jan 2009 ano
25.348
-2.054
-7.49%
1 jan 2010 ano
23.218
-2.13
-8.4%
1 jan 2011 ano
21.649
-1.569
-6.76%
1 jan 2012 ano
20.835
-0.814
-3.76%
1 jan 2013 ano
20.199
-0.636
-3.05%
1 jan 2014 ano
19.269
-0.93
-4.6%
1 jan 2015 ano
17.896
-1.373
-7.13%
1 jan 2016 ano
16.481
-1.415
-7.91%
Classificação de países por estatísticas atuais por anos


Comentários: