29
/pt/
pt
AIzaSyAYiBZKx7MnpbEhh9jyipgxe19OcubqV5w
April 1, 2024
47111
Lower middle income
LMC
false
2
1
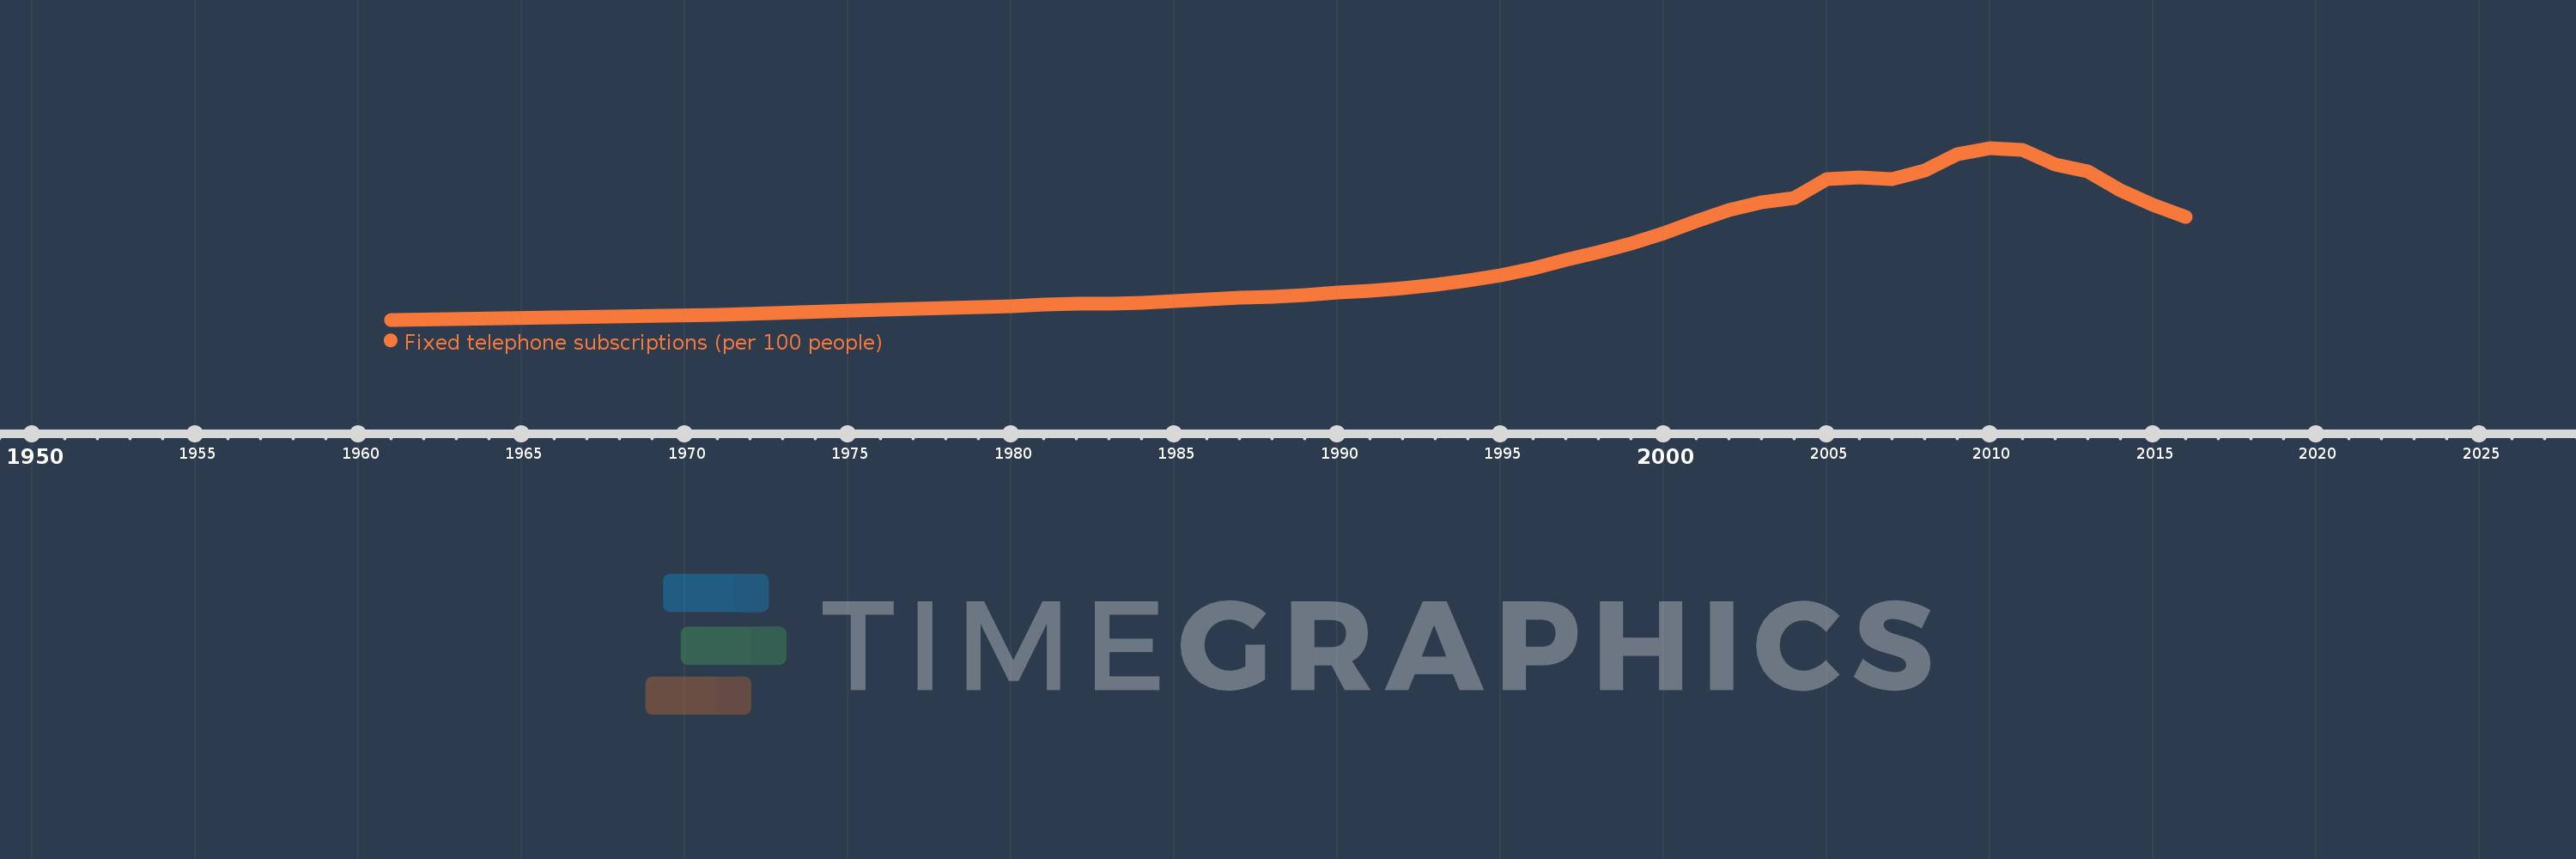
Fixed telephone subscriptions (per 100 people)
2016,2015,2014,2013,2012,2011,2010,2009,2008,2007,2006,2005,2004,2003,2002,2001,2000,1999,1998,1997,1996,1995,1994,1993,1992,1991,1990,1989,1988,1987,1986,1985,1984,1983,1982,1981,1980,1979,1978,1977,1976,1971,1966,1961
Estas estatísticas em outros países:
AfghanistanAlbaniaAlgeriaAmerican SamoaAndorraAngolaAntigua and BarbudaArab WorldArgentinaArmeniaArubaAustraliaAustriaAzerbaijanBahamas, TheBahrainBangladeshBarbadosBelarusBelgiumBelizeBeninBermudaBhutanBoliviaBosnia and HerzegovinaBotswanaBrazilBritish Virgin IslandsBrunei DarussalamBulgariaBurkina FasoBurundiCabo VerdeCambodiaCameroonCanadaCaribbean small statesCayman IslandsCentral African RepublicCentral Europe and the BalticsChadChileChinaColombiaComorosCongo, Dem. Rep.Congo, Rep.Costa RicaCote d'IvoireCroatiaCubaCuracaoCyprusCzech RepublicDenmarkDjiboutiDominicaDominican RepublicEarly-demographic dividendEast Asia & PacificEast Asia & Pacific (excluding high income)East Asia & Pacific (IDA & IBRD countries)EcuadorEgypt, Arab Rep.El SalvadorEquatorial GuineaEritreaEstoniaEthiopiaEuro areaEurope & Central AsiaEurope & Central Asia (excluding high income)Europe & Central Asia (IDA & IBRD countries)European UnionFaroe IslandsFijiFinlandFragile and conflict affected situationsFranceFrench PolynesiaGabonGambia, TheGeorgiaGermanyGhanaGibraltarGreeceGreenlandGrenadaGuamGuatemalaGuineaGuinea-BissauGuyanaHaitiHeavily indebted poor countries (HIPC)High incomeHondurasHong Kong SAR, ChinaHungaryIBRD onlyIcelandIDA & IBRD totalIDA blendIDA onlyIDA totalIndiaIndonesiaIran, Islamic Rep.IraqIrelandIsraelItalyJamaicaJapanJordanKazakhstanKenyaKiribatiKorea, Dem. People’s Rep.Korea, Rep.KosovoKuwaitKyrgyz RepublicLao PDRLate-demographic dividendLatin America & Caribbean Latin America & Caribbean (excluding high income)Latin America & the Caribbean (IDA & IBRD countries)LatviaLeast developed countries: UN classificationLebanonLesothoLiberiaLibyaLiechtensteinLithuaniaLow & middle incomeLow incomeLower middle incomeLuxembourgMacao SAR, ChinaMacedonia, FYRMadagascarMalawiMalaysiaMaldivesMaliMaltaMarshall IslandsMauritaniaMauritiusMexicoMicronesia, Fed. Sts.Middle East & North AfricaMiddle East & North Africa (excluding high income)Middle East & North Africa (IDA & IBRD countries)Middle incomeMoldovaMonacoMongoliaMontenegroMoroccoMozambiqueMyanmarNamibiaNauruNepalNetherlandsNew CaledoniaNew ZealandNicaraguaNigerNigeriaNorth AmericaNorthern Mariana IslandsNorwayOECD membersOmanOther small statesPacific island small statesPakistanPalauPanamaPapua New GuineaParaguayPeruPhilippinesPolandPortugalPost-demographic dividendPre-demographic dividendPuerto RicoQatarRomaniaRussian FederationRwandaSamoaSan MarinoSao Tome and PrincipeSaudi ArabiaSenegalSerbiaSeychellesSierra LeoneSingaporeSlovak RepublicSloveniaSmall statesSolomon IslandsSomaliaSouth AfricaSouth AsiaSouth Asia (IDA & IBRD)South SudanSpainSri LankaSt. Kitts and NevisSt. LuciaSt. Vincent and the GrenadinesSub-Saharan Africa Sub-Saharan Africa (excluding high income)Sub-Saharan Africa (IDA & IBRD countries)SudanSurinameSwazilandSwedenSwitzerlandSyrian Arab RepublicTajikistanTanzaniaThailandTimor-LesteTogoTongaTrinidad and TobagoTunisiaTurkeyTurkmenistanTurks and Caicos IslandsTuvaluUgandaUkraineUnited Arab EmiratesUnited KingdomUnited StatesUpper middle incomeUruguayUzbekistanVanuatuVenezuela, RBVietnamVirgin Islands (U.S.)West Bank and GazaWorldYemen, Rep.ZambiaZimbabwe Linha do tempo:
Nesta escala de tempo está apresentado um gráfico de 1961 ano até 2016 ano Lower middle income. Dados de 1960 ano ausente. O número de observações reais por data: 44.
Fonte (nome):
Indicadores de desenvolvimento mundial
Fonte (organização):
International Telecommunication Union, World Telecommunication/ICT Development Report and database.
Categorias:
Infrastructure
Foi atualizado:
23 abr 2017 ano
Indicadores de alterações dos valores ao longo dos anos
Mínimo:
0.267
1 jan 1961 ano
Máximo:
5.684
1 jan 2010 ano
Na data de observação
Valor
Mudança absoluta
A alteração em relação ao valor anterior
1 jan 1961 ano
0.267
+0.267
0.0%
1 jan 1966 ano
0.347
+0.08
29.86%
1 jan 1971 ano
0.424
+0.077
22.19%
1 jan 1976 ano
0.572
+0.148
34.98%
1 jan 1977 ano
0.605
+0.033
5.77%
1 jan 1978 ano
0.641
+0.037
6.05%
1 jan 1979 ano
0.672
+0.03
4.75%
1 jan 1980 ano
0.704
+0.032
4.74%
1 jan 1981 ano
0.75
+0.047
6.64%
1 jan 1982 ano
0.764
+0.014
1.89%
1 jan 1983 ano
0.765
+0.0
0.04%
1 jan 1984 ano
0.807
+0.042
5.5%
1 jan 1985 ano
0.848
+0.041
5.06%
1 jan 1986 ano
0.901
+0.053
6.31%
1 jan 1987 ano
0.953
+0.052
5.81%
1 jan 1988 ano
0.99
+0.037
3.87%
1 jan 1989 ano
1.044
+0.054
5.41%
1 jan 1990 ano
1.113
+0.069
6.61%
1 jan 1991 ano
1.183
+0.07
6.33%
1 jan 1992 ano
1.274
+0.091
7.67%
1 jan 1993 ano
1.374
+0.099
7.81%
1 jan 1994 ano
1.495
+0.121
8.84%
1 jan 1995 ano
1.67
+0.175
11.68%
1 jan 1996 ano
1.887
+0.217
13.0%
1 jan 1997 ano
2.157
+0.27
14.32%
1 jan 1998 ano
2.396
+0.239
11.08%
1 jan 1999 ano
2.679
+0.283
11.81%
1 jan 2000 ano
3.008
+0.33
12.3%
1 jan 2001 ano
3.37
+0.362
12.04%
1 jan 2002 ano
3.73
+0.36
10.67%
1 jan 2003 ano
3.975
+0.245
6.58%
1 jan 2004 ano
4.1
+0.125
3.13%
1 jan 2005 ano
4.69
+0.59
14.39%
1 jan 2006 ano
4.758
+0.068
1.45%
1 jan 2007 ano
4.69
-0.068
-1.44%
1 jan 2008 ano
4.97
+0.28
5.98%
1 jan 2009 ano
5.488
+0.518
10.43%
1 jan 2010 ano
5.684
+0.196
3.57%
1 jan 2011 ano
5.609
-0.075
-1.32%
1 jan 2012 ano
5.168
-0.441
-7.86%
1 jan 2013 ano
4.948
-0.22
-4.26%
1 jan 2014 ano
4.357
-0.591
-11.94%
1 jan 2015 ano
3.877
-0.48
-11.01%
1 jan 2016 ano
3.516
-0.361
-9.31%
Classificação de países por estatísticas atuais por anos


Comentários: