29
/pt/
pt
AIzaSyAYiBZKx7MnpbEhh9jyipgxe19OcubqV5w
April 1, 2024
283209
Virgin Islands (U.S.)
VIR
true
2
1
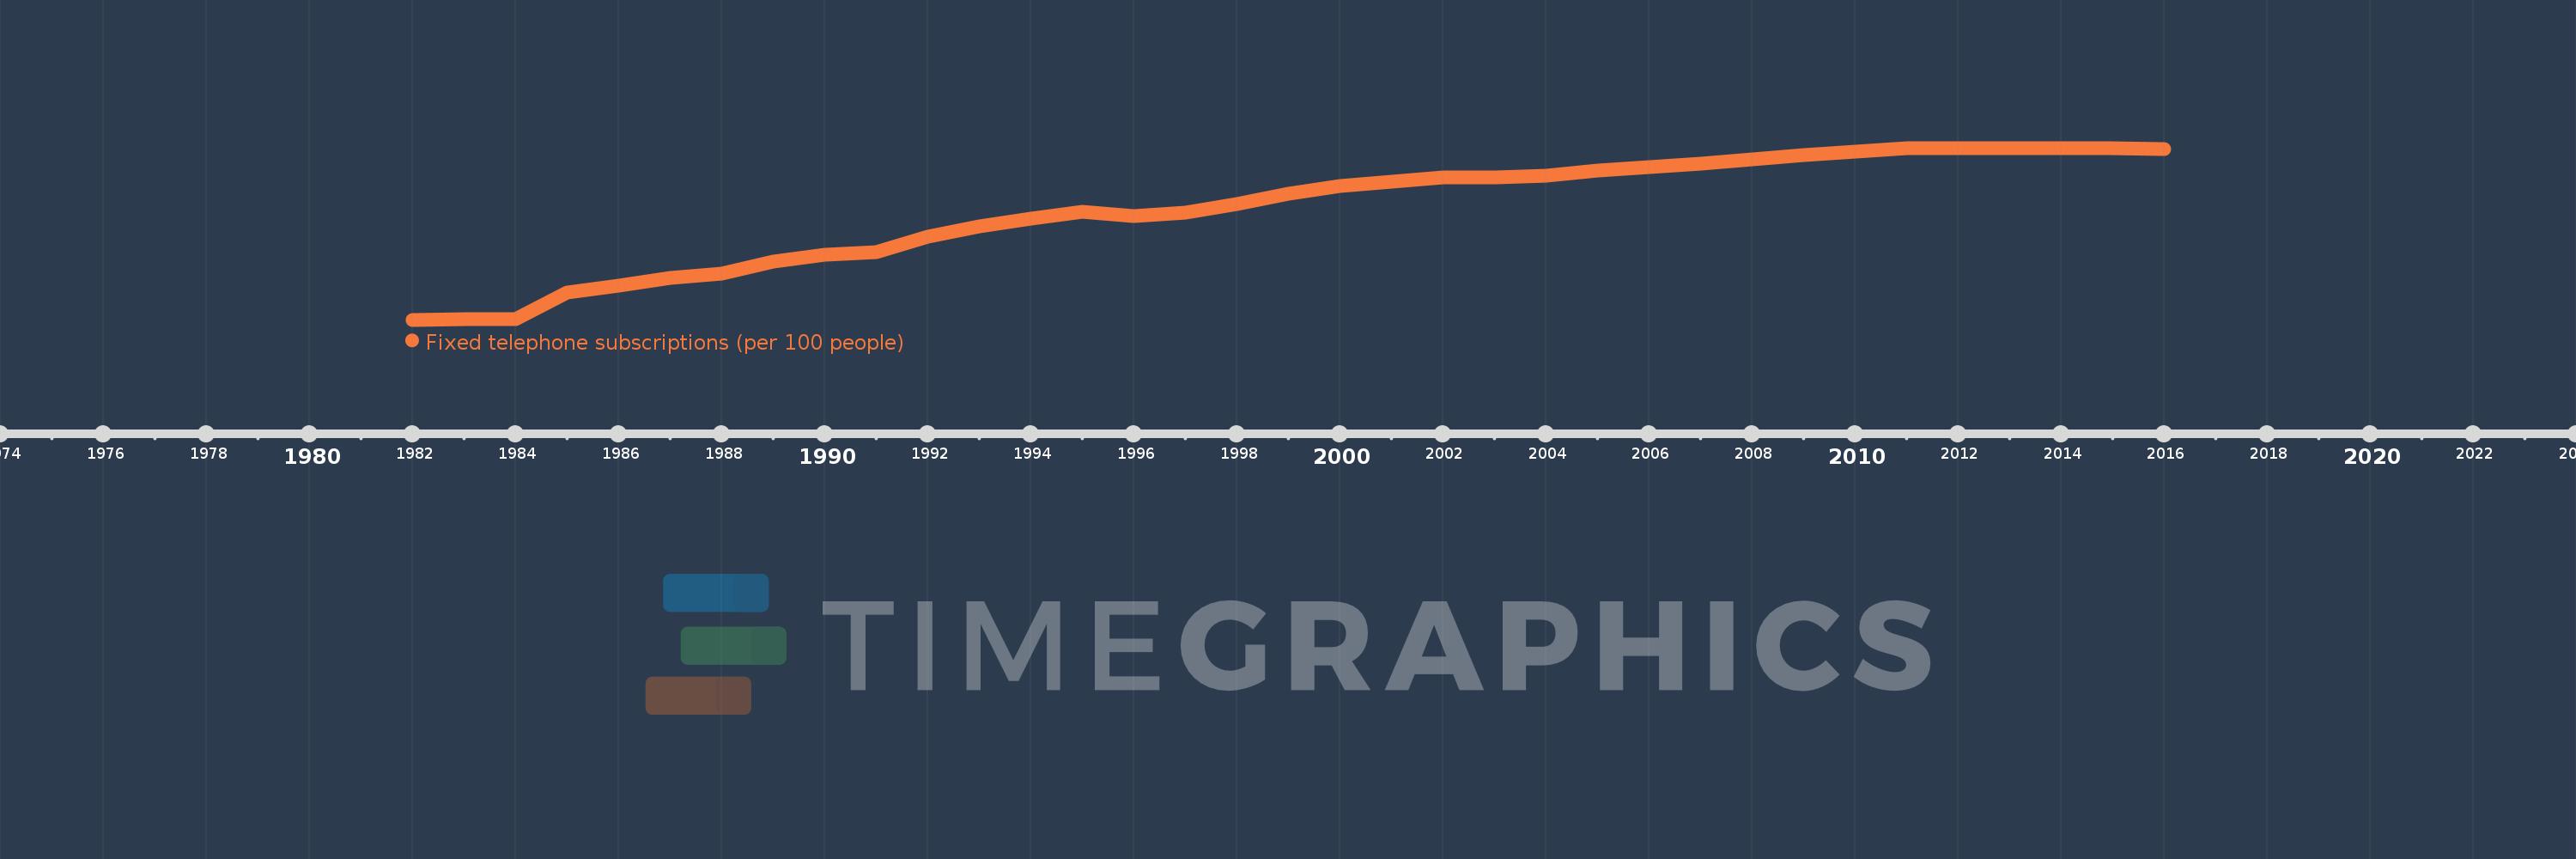
Fixed telephone subscriptions (per 100 people)
2016,2015,2014,2011,2010,2009,2008,2007,2006,2005,2004,2003,2002,2001,2000,1999,1998,1997,1996,1995,1994,1993,1992,1991,1990,1989,1988,1987,1986,1985,1984,1983,1982
Estas estatísticas em outros países:
AfghanistanAlbaniaAlgeriaAmerican SamoaAndorraAngolaAntigua and BarbudaArab WorldArgentinaArmeniaArubaAustraliaAustriaAzerbaijanBahamas, TheBahrainBangladeshBarbadosBelarusBelgiumBelizeBeninBermudaBhutanBoliviaBosnia and HerzegovinaBotswanaBrazilBritish Virgin IslandsBrunei DarussalamBulgariaBurkina FasoBurundiCabo VerdeCambodiaCameroonCanadaCaribbean small statesCayman IslandsCentral African RepublicCentral Europe and the BalticsChadChileChinaColombiaComorosCongo, Dem. Rep.Congo, Rep.Costa RicaCote d'IvoireCroatiaCubaCuracaoCyprusCzech RepublicDenmarkDjiboutiDominicaDominican RepublicEarly-demographic dividendEast Asia & PacificEast Asia & Pacific (excluding high income)East Asia & Pacific (IDA & IBRD countries)EcuadorEgypt, Arab Rep.El SalvadorEquatorial GuineaEritreaEstoniaEthiopiaEuro areaEurope & Central AsiaEurope & Central Asia (excluding high income)Europe & Central Asia (IDA & IBRD countries)European UnionFaroe IslandsFijiFinlandFragile and conflict affected situationsFranceFrench PolynesiaGabonGambia, TheGeorgiaGermanyGhanaGibraltarGreeceGreenlandGrenadaGuamGuatemalaGuineaGuinea-BissauGuyanaHaitiHeavily indebted poor countries (HIPC)High incomeHondurasHong Kong SAR, ChinaHungaryIBRD onlyIcelandIDA & IBRD totalIDA blendIDA onlyIDA totalIndiaIndonesiaIran, Islamic Rep.IraqIrelandIsraelItalyJamaicaJapanJordanKazakhstanKenyaKiribatiKorea, Dem. People’s Rep.Korea, Rep.KosovoKuwaitKyrgyz RepublicLao PDRLate-demographic dividendLatin America & Caribbean Latin America & Caribbean (excluding high income)Latin America & the Caribbean (IDA & IBRD countries)LatviaLeast developed countries: UN classificationLebanonLesothoLiberiaLibyaLiechtensteinLithuaniaLow & middle incomeLow incomeLower middle incomeLuxembourgMacao SAR, ChinaMacedonia, FYRMadagascarMalawiMalaysiaMaldivesMaliMaltaMarshall IslandsMauritaniaMauritiusMexicoMicronesia, Fed. Sts.Middle East & North AfricaMiddle East & North Africa (excluding high income)Middle East & North Africa (IDA & IBRD countries)Middle incomeMoldovaMonacoMongoliaMontenegroMoroccoMozambiqueMyanmarNamibiaNauruNepalNetherlandsNew CaledoniaNew ZealandNicaraguaNigerNigeriaNorth AmericaNorthern Mariana IslandsNorwayOECD membersOmanOther small statesPacific island small statesPakistanPalauPanamaPapua New GuineaParaguayPeruPhilippinesPolandPortugalPost-demographic dividendPre-demographic dividendPuerto RicoQatarRomaniaRussian FederationRwandaSamoaSan MarinoSao Tome and PrincipeSaudi ArabiaSenegalSerbiaSeychellesSierra LeoneSingaporeSlovak RepublicSloveniaSmall statesSolomon IslandsSomaliaSouth AfricaSouth AsiaSouth Asia (IDA & IBRD)South SudanSpainSri LankaSt. Kitts and NevisSt. LuciaSt. Vincent and the GrenadinesSub-Saharan Africa Sub-Saharan Africa (excluding high income)Sub-Saharan Africa (IDA & IBRD countries)SudanSurinameSwazilandSwedenSwitzerlandSyrian Arab RepublicTajikistanTanzaniaThailandTimor-LesteTogoTongaTrinidad and TobagoTunisiaTurkeyTurkmenistanTurks and Caicos IslandsTuvaluUgandaUkraineUnited Arab EmiratesUnited KingdomUnited StatesUpper middle incomeUruguayUzbekistanVanuatuVenezuela, RBVietnamVirgin Islands (U.S.)West Bank and GazaWorldYemen, Rep.ZambiaZimbabwe Linha do tempo:
Nesta escala de tempo está apresentado um gráfico de 1982 ano até 2016 ano Virgin Islands (U.S.). Dados de 1981 ano ausente. O número de observações reais por data: 33.
Fonte (nome):
Indicadores de desenvolvimento mundial
Fonte (organização):
International Telecommunication Union, World Telecommunication/ICT Development Report and database.
Categorias:
Infrastructure
Foi atualizado:
23 abr 2017 ano
Indicadores de alterações dos valores ao longo dos anos
Mínimo:
28.937
1 jan 1982 ano
Máximo:
71.277
1 jan 2014 ano
Na data de observação
Valor
Mudança absoluta
A alteração em relação ao valor anterior
1 jan 1982 ano
28.937
+28.937
0.0%
1 jan 1983 ano
29.038
+0.101
0.35%
1 jan 1984 ano
29.032
-0.007
-0.02%
1 jan 1985 ano
35.745
+6.713
23.12%
1 jan 1986 ano
37.261
+1.516
4.24%
1 jan 1987 ano
39.16
+1.9
5.1%
1 jan 1988 ano
40.273
+1.112
2.84%
1 jan 1989 ano
43.308
+3.036
7.54%
1 jan 1990 ano
44.882
+1.574
3.63%
1 jan 1991 ano
45.693
+0.811
1.81%
1 jan 1992 ano
49.322
+3.629
7.94%
1 jan 1993 ano
51.889
+2.567
5.2%
1 jan 1994 ano
53.87
+1.981
3.82%
1 jan 1995 ano
55.545
+1.676
3.11%
1 jan 1996 ano
54.495
-1.051
-1.89%
1 jan 1997 ano
55.275
+0.781
1.43%
1 jan 1998 ano
57.536
+2.261
4.09%
1 jan 1999 ano
59.897
+2.361
4.1%
1 jan 2000 ano
62.002
+2.105
3.51%
1 jan 2001 ano
62.927
+0.926
1.49%
1 jan 2002 ano
63.957
+1.029
1.64%
1 jan 2003 ano
63.981
+0.024
0.04%
1 jan 2004 ano
64.374
+0.394
0.62%
1 jan 2005 ano
65.616
+1.242
1.93%
1 jan 2006 ano
66.532
+0.915
1.4%
1 jan 2007 ano
67.468
+0.936
1.41%
1 jan 2008 ano
68.524
+1.056
1.56%
1 jan 2009 ano
69.483
+0.96
1.4%
1 jan 2010 ano
70.403
+0.919
1.32%
1 jan 2011 ano
71.253
+0.85
1.21%
1 jan 2014 ano
71.277
+0.024
0.03%
1 jan 2015 ano
71.26
-0.016
-0.02%
1 jan 2016 ano
71.09
-0.17
-0.24%
Classificação de países por estatísticas atuais por anos


Comentários: