29
/pt/
pt
AIzaSyAYiBZKx7MnpbEhh9jyipgxe19OcubqV5w
April 1, 2024
175304
Latvia
LVA
true
2
1
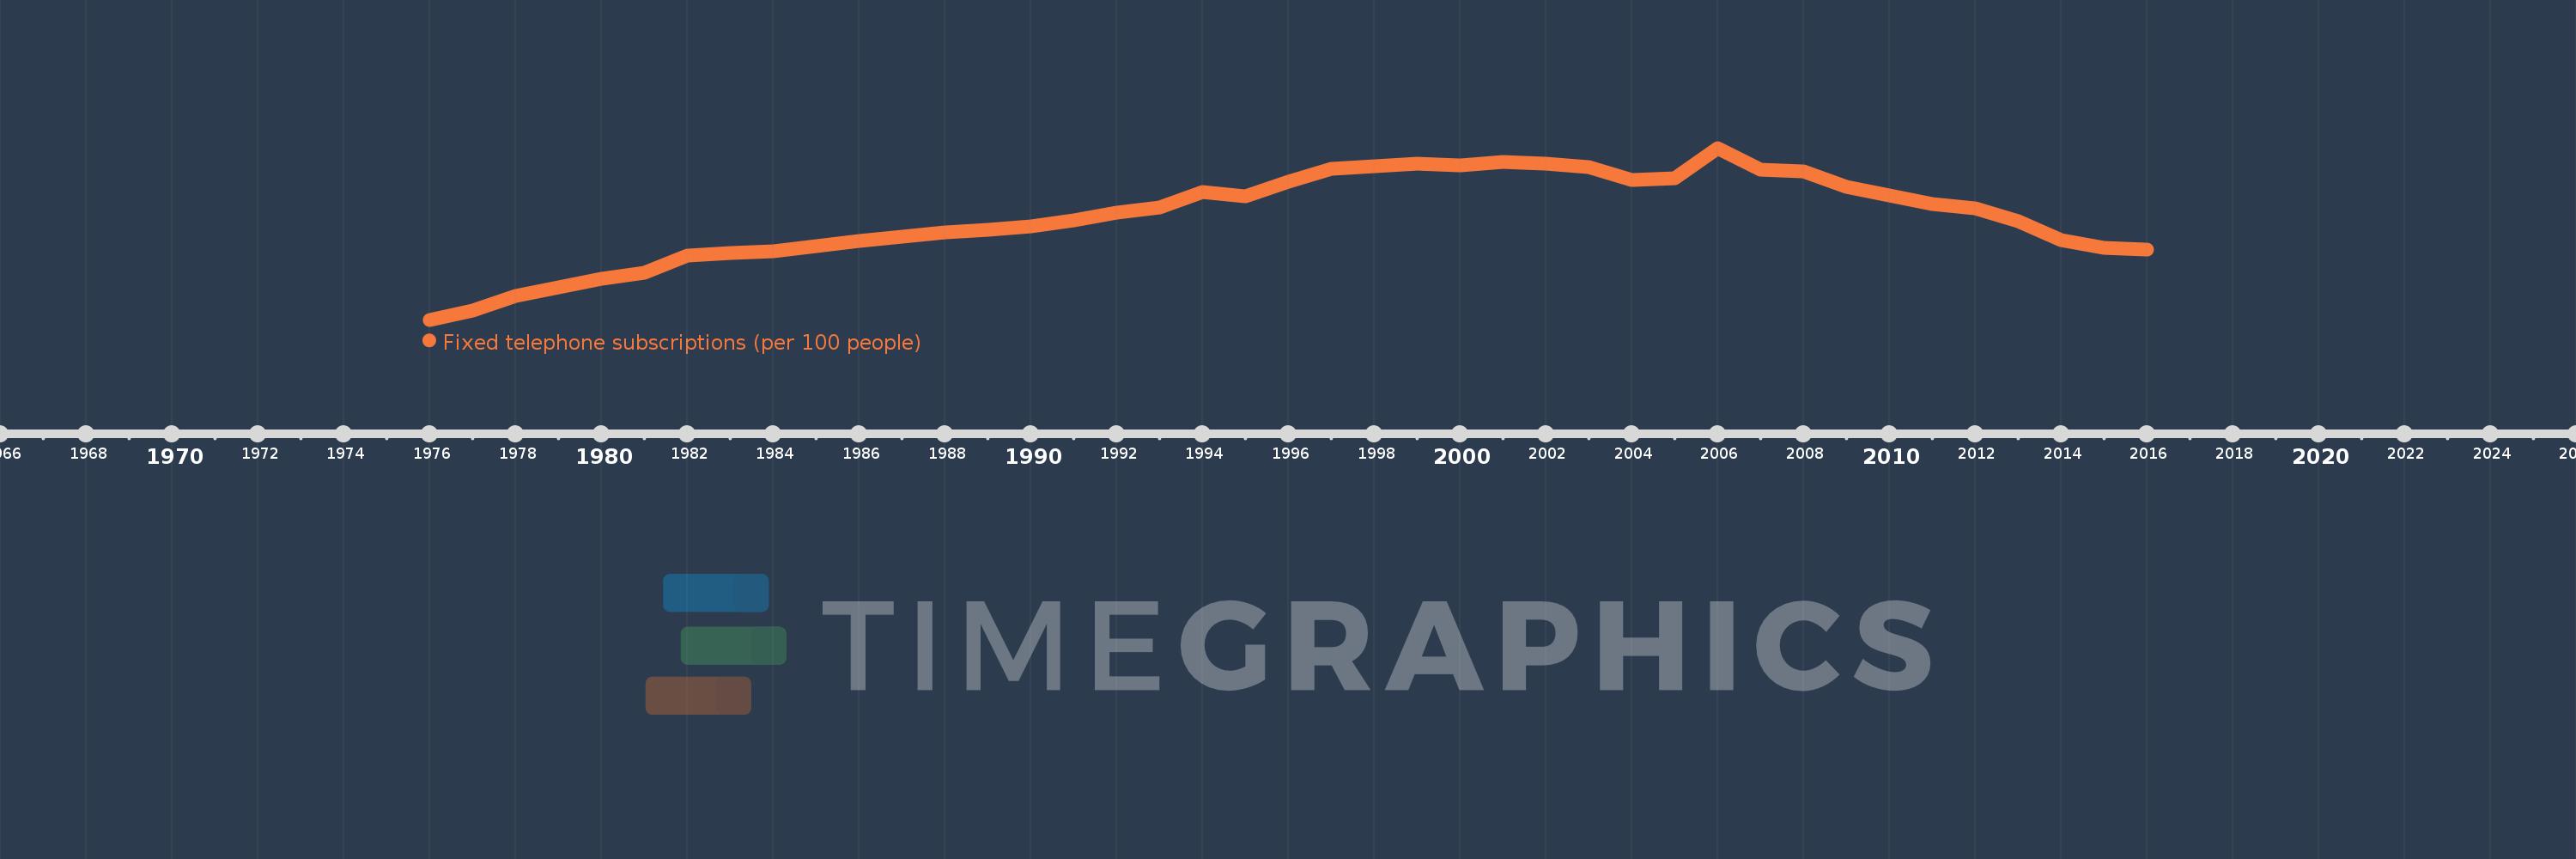
Fixed telephone subscriptions (per 100 people)
2016,2015,2014,2013,2012,2011,2010,2009,2008,2007,2006,2005,2004,2003,2002,2001,2000,1999,1998,1997,1996,1995,1994,1993,1992,1991,1990,1989,1988,1987,1986,1985,1984,1983,1982,1981,1980,1979,1978,1977,1976
Estas estatísticas em outros países:
AfghanistanAlbaniaAlgeriaAmerican SamoaAndorraAngolaAntigua and BarbudaArab WorldArgentinaArmeniaArubaAustraliaAustriaAzerbaijanBahamas, TheBahrainBangladeshBarbadosBelarusBelgiumBelizeBeninBermudaBhutanBoliviaBosnia and HerzegovinaBotswanaBrazilBritish Virgin IslandsBrunei DarussalamBulgariaBurkina FasoBurundiCabo VerdeCambodiaCameroonCanadaCaribbean small statesCayman IslandsCentral African RepublicCentral Europe and the BalticsChadChileChinaColombiaComorosCongo, Dem. Rep.Congo, Rep.Costa RicaCote d'IvoireCroatiaCubaCuracaoCyprusCzech RepublicDenmarkDjiboutiDominicaDominican RepublicEarly-demographic dividendEast Asia & PacificEast Asia & Pacific (excluding high income)East Asia & Pacific (IDA & IBRD countries)EcuadorEgypt, Arab Rep.El SalvadorEquatorial GuineaEritreaEstoniaEthiopiaEuro areaEurope & Central AsiaEurope & Central Asia (excluding high income)Europe & Central Asia (IDA & IBRD countries)European UnionFaroe IslandsFijiFinlandFragile and conflict affected situationsFranceFrench PolynesiaGabonGambia, TheGeorgiaGermanyGhanaGibraltarGreeceGreenlandGrenadaGuamGuatemalaGuineaGuinea-BissauGuyanaHaitiHeavily indebted poor countries (HIPC)High incomeHondurasHong Kong SAR, ChinaHungaryIBRD onlyIcelandIDA & IBRD totalIDA blendIDA onlyIDA totalIndiaIndonesiaIran, Islamic Rep.IraqIrelandIsraelItalyJamaicaJapanJordanKazakhstanKenyaKiribatiKorea, Dem. People’s Rep.Korea, Rep.KosovoKuwaitKyrgyz RepublicLao PDRLate-demographic dividendLatin America & Caribbean Latin America & Caribbean (excluding high income)Latin America & the Caribbean (IDA & IBRD countries)LatviaLeast developed countries: UN classificationLebanonLesothoLiberiaLibyaLiechtensteinLithuaniaLow & middle incomeLow incomeLower middle incomeLuxembourgMacao SAR, ChinaMacedonia, FYRMadagascarMalawiMalaysiaMaldivesMaliMaltaMarshall IslandsMauritaniaMauritiusMexicoMicronesia, Fed. Sts.Middle East & North AfricaMiddle East & North Africa (excluding high income)Middle East & North Africa (IDA & IBRD countries)Middle incomeMoldovaMonacoMongoliaMontenegroMoroccoMozambiqueMyanmarNamibiaNauruNepalNetherlandsNew CaledoniaNew ZealandNicaraguaNigerNigeriaNorth AmericaNorthern Mariana IslandsNorwayOECD membersOmanOther small statesPacific island small statesPakistanPalauPanamaPapua New GuineaParaguayPeruPhilippinesPolandPortugalPost-demographic dividendPre-demographic dividendPuerto RicoQatarRomaniaRussian FederationRwandaSamoaSan MarinoSao Tome and PrincipeSaudi ArabiaSenegalSerbiaSeychellesSierra LeoneSingaporeSlovak RepublicSloveniaSmall statesSolomon IslandsSomaliaSouth AfricaSouth AsiaSouth Asia (IDA & IBRD)South SudanSpainSri LankaSt. Kitts and NevisSt. LuciaSt. Vincent and the GrenadinesSub-Saharan Africa Sub-Saharan Africa (excluding high income)Sub-Saharan Africa (IDA & IBRD countries)SudanSurinameSwazilandSwedenSwitzerlandSyrian Arab RepublicTajikistanTanzaniaThailandTimor-LesteTogoTongaTrinidad and TobagoTunisiaTurkeyTurkmenistanTurks and Caicos IslandsTuvaluUgandaUkraineUnited Arab EmiratesUnited KingdomUnited StatesUpper middle incomeUruguayUzbekistanVanuatuVenezuela, RBVietnamVirgin Islands (U.S.)West Bank and GazaWorldYemen, Rep.ZambiaZimbabwe Linha do tempo:
Nesta escala de tempo está apresentado um gráfico de 1976 ano até 2016 ano Latvia. Dados de 1975 ano ausente. O número de observações reais por data: 41.
Fonte (nome):
Indicadores de desenvolvimento mundial
Fonte (organização):
International Telecommunication Union, World Telecommunication/ICT Development Report and database.
Categorias:
Infrastructure
Foi atualizado:
23 abr 2017 ano
Indicadores de alterações dos valores ao longo dos anos
Mínimo:
10.175
1 jan 1976 ano
Máximo:
32.82
1 jan 2006 ano
Na data de observação
Valor
Mudança absoluta
A alteração em relação ao valor anterior
1 jan 1976 ano
10.175
+10.175
0.0%
1 jan 1977 ano
11.335
+1.16
11.4%
1 jan 1978 ano
13.298
+1.963
17.32%
1 jan 1979 ano
14.446
+1.149
8.64%
1 jan 1980 ano
15.586
+1.139
7.89%
1 jan 1981 ano
16.313
+0.727
4.66%
1 jan 1982 ano
18.615
+2.302
14.11%
1 jan 1983 ano
18.925
+0.31
1.66%
1 jan 1984 ano
19.224
+0.299
1.58%
1 jan 1985 ano
19.891
+0.667
3.47%
1 jan 1986 ano
20.526
+0.635
3.19%
1 jan 1987 ano
21.117
+0.591
2.88%
1 jan 1988 ano
21.674
+0.557
2.64%
1 jan 1989 ano
22.015
+0.341
1.57%
1 jan 1990 ano
22.508
+0.493
2.24%
1 jan 1991 ano
23.273
+0.765
3.4%
1 jan 1992 ano
24.311
+1.038
4.46%
1 jan 1993 ano
24.986
+0.675
2.78%
1 jan 1994 ano
27.03
+2.044
8.18%
1 jan 1995 ano
26.416
-0.614
-2.27%
1 jan 1996 ano
28.316
+1.9
7.19%
1 jan 1997 ano
30.069
+1.753
6.19%
1 jan 1998 ano
30.399
+0.33
1.1%
1 jan 1999 ano
30.741
+0.342
1.12%
1 jan 2000 ano
30.55
-0.191
-0.62%
1 jan 2001 ano
30.98
+0.43
1.41%
1 jan 2002 ano
30.774
-0.206
-0.67%
1 jan 2003 ano
30.26
-0.514
-1.67%
1 jan 2004 ano
28.58
-1.68
-5.55%
1 jan 2005 ano
28.811
+0.231
0.81%
1 jan 2006 ano
32.82
+4.009
13.92%
1 jan 2007 ano
29.917
-2.904
-8.85%
1 jan 2008 ano
29.718
-0.198
-0.66%
1 jan 2009 ano
27.726
-1.992
-6.7%
1 jan 2010 ano
26.589
-1.137
-4.1%
1 jan 2011 ano
25.453
-1.136
-4.27%
1 jan 2012 ano
24.903
-0.55
-2.16%
1 jan 2013 ano
23.109
-1.795
-7.21%
1 jan 2014 ano
20.631
-2.478
-10.72%
1 jan 2015 ano
19.597
-1.034
-5.01%
1 jan 2016 ano
19.475
-0.122
-0.62%
Classificação de países por estatísticas atuais por anos


Comentários: