29
/pt/
pt
AIzaSyAYiBZKx7MnpbEhh9jyipgxe19OcubqV5w
April 1, 2024
251562
St. Martin (French part)
MAF
true
2
1
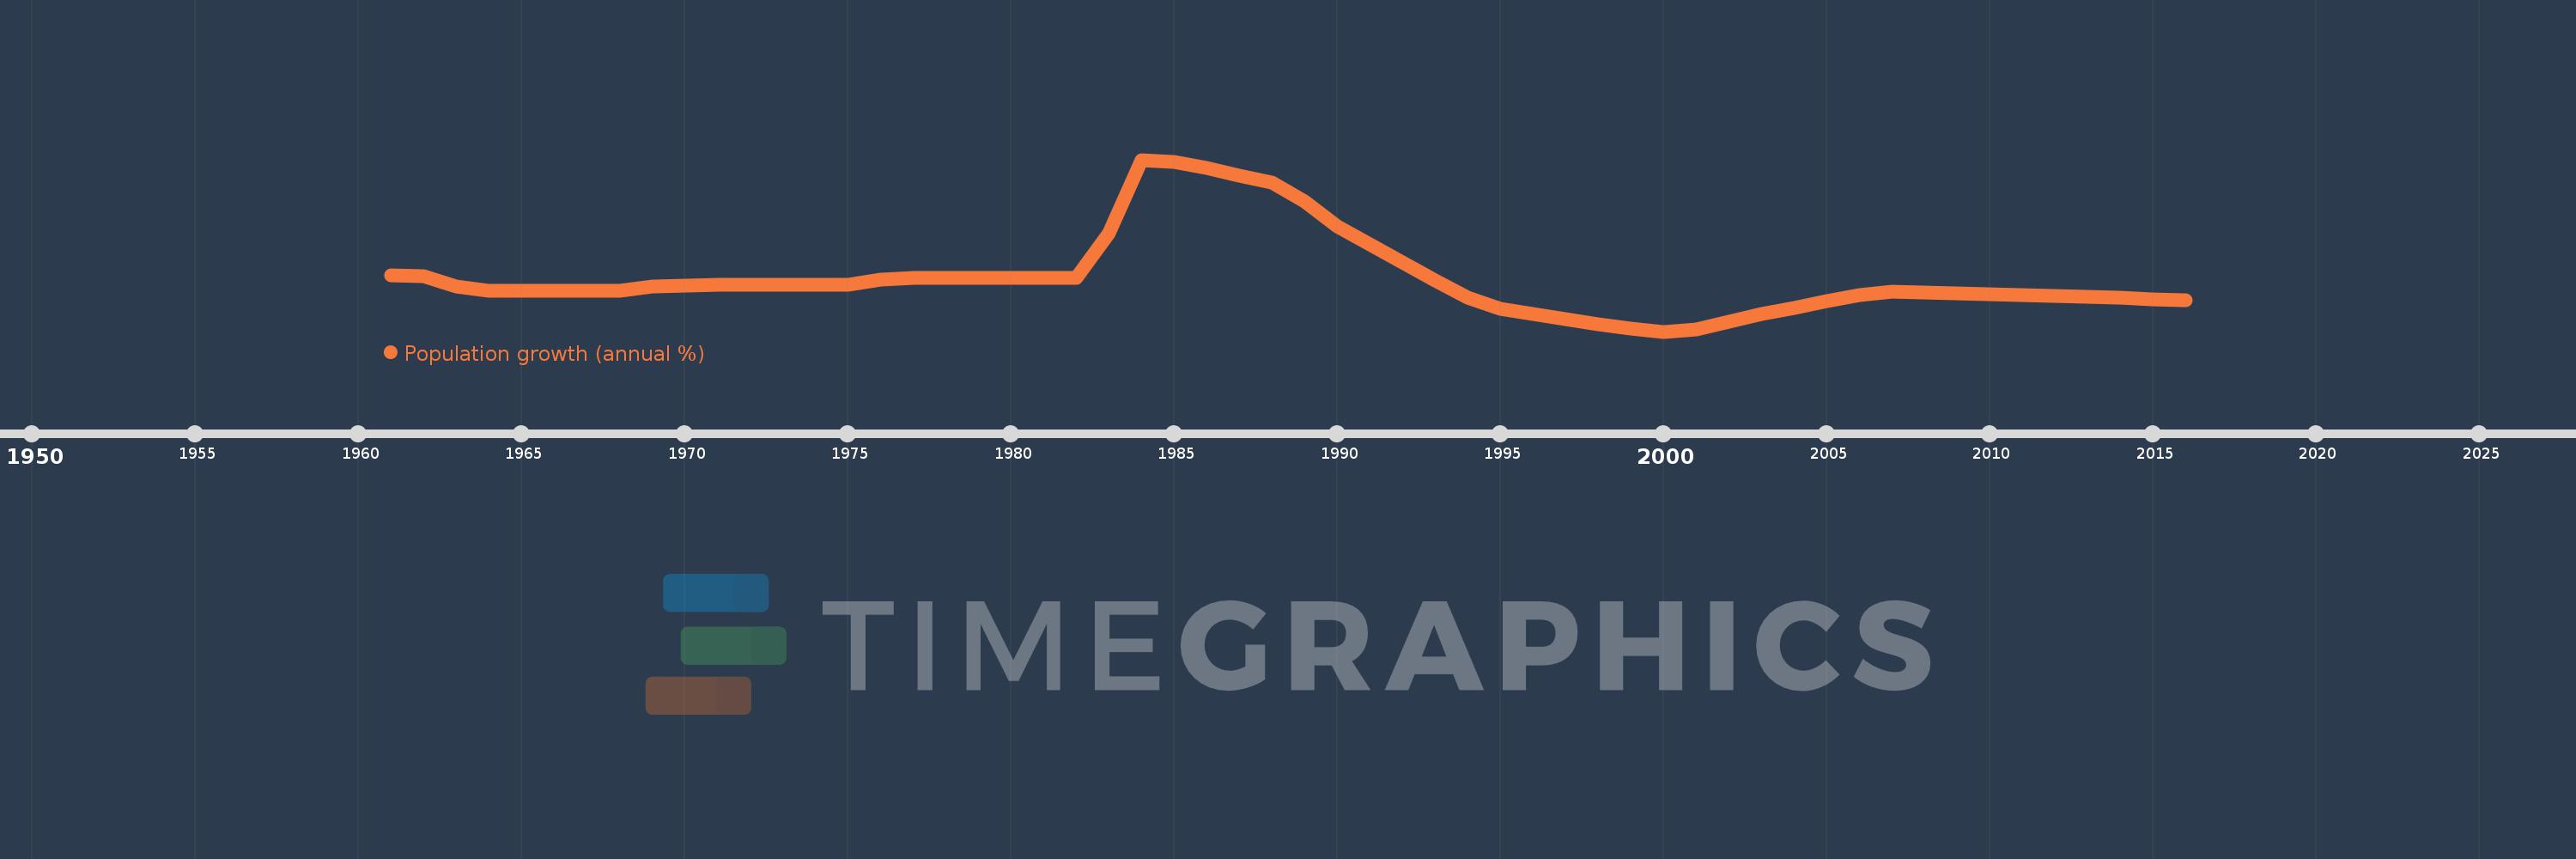
Population growth (annual %)
2016,2015,2014,2013,2012,2011,2010,2009,2008,2007,2006,2005,2004,2003,2002,2001,2000,1999,1998,1997,1996,1995,1994,1993,1992,1991,1990,1989,1988,1987,1986,1985,1984,1983,1982,1981,1980,1979,1978,1977,1976,1975,1974,1973,1972,1971,1970,1969,1968,1967,1966,1965,1964,1963,1962,1961
Estas estatísticas em outros países:
AfghanistanAlbaniaAlgeriaAmerican SamoaAndorraAngolaAntigua and BarbudaArab WorldArgentinaArmeniaArubaAustraliaAustriaAzerbaijanBahamas, TheBahrainBangladeshBarbadosBelarusBelgiumBelizeBeninBermudaBhutanBoliviaBosnia and HerzegovinaBotswanaBrazilBritish Virgin IslandsBrunei DarussalamBulgariaBurkina FasoBurundiCabo VerdeCambodiaCameroonCanadaCaribbean small statesCayman IslandsCentral African RepublicCentral Europe and the BalticsChadChannel IslandsChileChinaColombiaComorosCongo, Dem. Rep.Congo, Rep.Costa RicaCote d'IvoireCroatiaCubaCuracaoCyprusCzech RepublicDenmarkDjiboutiDominicaDominican RepublicEarly-demographic dividendEast Asia & PacificEast Asia & Pacific (excluding high income)East Asia & Pacific (IDA & IBRD countries)EcuadorEgypt, Arab Rep.El SalvadorEquatorial GuineaEritreaEstoniaEthiopiaEuro areaEurope & Central AsiaEurope & Central Asia (excluding high income)Europe & Central Asia (IDA & IBRD countries)European UnionFaroe IslandsFijiFinlandFragile and conflict affected situationsFranceFrench PolynesiaGabonGambia, TheGeorgiaGermanyGhanaGibraltarGreeceGreenlandGrenadaGuamGuatemalaGuineaGuinea-BissauGuyanaHaitiHeavily indebted poor countries (HIPC)High incomeHondurasHong Kong SAR, ChinaHungaryIBRD onlyIcelandIDA & IBRD totalIDA blendIDA onlyIDA totalIndiaIndonesiaIran, Islamic Rep.IraqIrelandIsle of ManIsraelItalyJamaicaJapanJordanKazakhstanKenyaKiribatiKorea, Dem. People’s Rep.Korea, Rep.KosovoKuwaitKyrgyz RepublicLao PDRLate-demographic dividendLatin America & Caribbean Latin America & Caribbean (excluding high income)Latin America & the Caribbean (IDA & IBRD countries)LatviaLeast developed countries: UN classificationLebanonLesothoLiberiaLibyaLiechtensteinLithuaniaLow & middle incomeLow incomeLower middle incomeLuxembourgMacao SAR, ChinaMacedonia, FYRMadagascarMalawiMalaysiaMaldivesMaliMaltaMarshall IslandsMauritaniaMauritiusMexicoMicronesia, Fed. Sts.Middle East & North AfricaMiddle East & North Africa (excluding high income)Middle East & North Africa (IDA & IBRD countries)Middle incomeMoldovaMonacoMongoliaMontenegroMoroccoMozambiqueMyanmarNamibiaNauruNepalNetherlandsNew CaledoniaNew ZealandNicaraguaNigerNigeriaNorth AmericaNorthern Mariana IslandsNorwayOECD membersOmanOther small statesPacific island small statesPakistanPalauPanamaPapua New GuineaParaguayPeruPhilippinesPolandPortugalPost-demographic dividendPre-demographic dividendPuerto RicoQatarRomaniaRussian FederationRwandaSamoaSan MarinoSao Tome and PrincipeSaudi ArabiaSenegalSerbiaSeychellesSierra LeoneSingaporeSint Maarten (Dutch part)Slovak RepublicSloveniaSmall statesSolomon IslandsSomaliaSouth AfricaSouth AsiaSouth Asia (IDA & IBRD)South SudanSpainSri LankaSt. Kitts and NevisSt. LuciaSt. Martin (French part)St. Vincent and the GrenadinesSub-Saharan Africa Sub-Saharan Africa (excluding high income)Sub-Saharan Africa (IDA & IBRD countries)SudanSurinameSwazilandSwedenSwitzerlandSyrian Arab RepublicTajikistanTanzaniaThailandTimor-LesteTogoTongaTrinidad and TobagoTunisiaTurkeyTurkmenistanTurks and Caicos IslandsTuvaluUgandaUkraineUnited Arab EmiratesUnited KingdomUnited StatesUpper middle incomeUruguayUzbekistanVanuatuVenezuela, RBVietnamVirgin Islands (U.S.)West Bank and GazaWorldYemen, Rep.ZambiaZimbabwe Linha do tempo:
Nesta escala de tempo está apresentado um gráfico de 1961 ano até 2016 ano St. Martin (French part). Dados de 1960 ano ausente. O número de observações reais por data: 56.
Fonte (nome):
Indicadores de desenvolvimento mundial
Fonte (organização):
Derived from total population. Population source: (1) United Nations Population Division. World Population Prospects, (2) United Nations Statistical Division. Population and Vital Statistics Report (various years), (3) Census reports and other statistical
Categorias:
Climate Change, Health
Foi atualizado:
23 abr 2017 ano
Indicadores de alterações dos valores ao longo dos anos
Mínimo:
-3.53
1 jan 2000 ano
Máximo:
19.597
1 jan 1984 ano
Na data de observação
Valor
Mudança absoluta
A alteração em relação ao valor anterior
1 jan 1961 ano
4.005
+4.005
0.0%
1 jan 1962 ano
3.986
-0.019
-0.49%
1 jan 1963 ano
2.506
-1.48
-37.13%
1 jan 1964 ano
1.952
-0.554
-22.11%
1 jan 1965 ano
1.957
+0.005
0.24%
1 jan 1966 ano
1.94
-0.017
-0.86%
1 jan 1967 ano
1.943
+0.004
0.19%
1 jan 1968 ano
1.946
+0.003
0.14%
1 jan 1969 ano
2.511
+0.565
29.05%
1 jan 1970 ano
2.714
+0.203
8.08%
1 jan 1971 ano
2.734
+0.02
0.74%
1 jan 1972 ano
2.733
-0.001
-0.05%
1 jan 1973 ano
2.73
-0.003
-0.12%
1 jan 1974 ano
2.725
-0.005
-0.18%
1 jan 1975 ano
2.718
-0.006
-0.24%
1 jan 1976 ano
3.444
+0.726
26.71%
1 jan 1977 ano
3.729
+0.284
8.25%
1 jan 1978 ano
3.728
-0.001
-0.03%
1 jan 1979 ano
3.722
-0.006
-0.16%
1 jan 1980 ano
3.739
+0.017
0.46%
1 jan 1981 ano
3.723
-0.016
-0.43%
1 jan 1982 ano
3.729
+0.006
0.17%
1 jan 1983 ano
9.706
+5.977
160.29%
1 jan 1984 ano
19.597
+9.891
101.9%
1 jan 1985 ano
19.282
-0.315
-1.61%
1 jan 1986 ano
18.518
-0.764
-3.96%
1 jan 1987 ano
17.507
-1.011
-5.46%
1 jan 1988 ano
16.507
-1.001
-5.71%
1 jan 1989 ano
13.979
-2.527
-15.31%
1 jan 1990 ano
10.678
-3.301
-23.61%
1 jan 1991 ano
8.183
-2.495
-23.37%
1 jan 1992 ano
5.773
-2.41
-29.45%
1 jan 1993 ano
3.31
-2.463
-42.66%
1 jan 1994 ano
1.046
-2.264
-68.39%
1 jan 1995 ano
-0.422
-1.469
-140.34%
1 jan 1996 ano
-1.173
-0.751
177.92%
1 jan 1997 ano
-1.882
-0.709
60.46%
1 jan 1998 ano
-2.517
-0.635
33.73%
1 jan 1999 ano
-3.069
-0.551
21.9%
1 jan 2000 ano
-3.53
-0.462
15.04%
1 jan 2001 ano
-3.193
+0.337
-9.54%
1 jan 2002 ano
-2.144
+1.05
-32.87%
1 jan 2003 ano
-1.202
+0.942
-43.92%
1 jan 2004 ano
-0.317
+0.885
-73.6%
1 jan 2005 ano
0.55
+0.868
-273.36%
1 jan 2006 ano
1.415
+0.864
157.06%
1 jan 2007 ano
1.804
+0.389
27.52%
1 jan 2008 ano
1.713
-0.091
-5.03%
1 jan 2009 ano
1.616
-0.097
-5.66%
1 jan 2010 ano
1.5
-0.116
-7.19%
1 jan 2011 ano
1.382
-0.118
-7.87%
1 jan 2012 ano
1.249
-0.133
-9.63%
1 jan 2013 ano
1.117
-0.132
-10.54%
1 jan 2014 ano
0.98
-0.137
-12.26%
1 jan 2015 ano
0.847
-0.133
-13.58%
1 jan 2016 ano
0.708
-0.139
-16.44%
Classificação de países por estatísticas atuais por anos


Comentários: