29
/pt/
pt
AIzaSyAYiBZKx7MnpbEhh9jyipgxe19OcubqV5w
April 1, 2024
257694
Switzerland
CHE
true
2
1
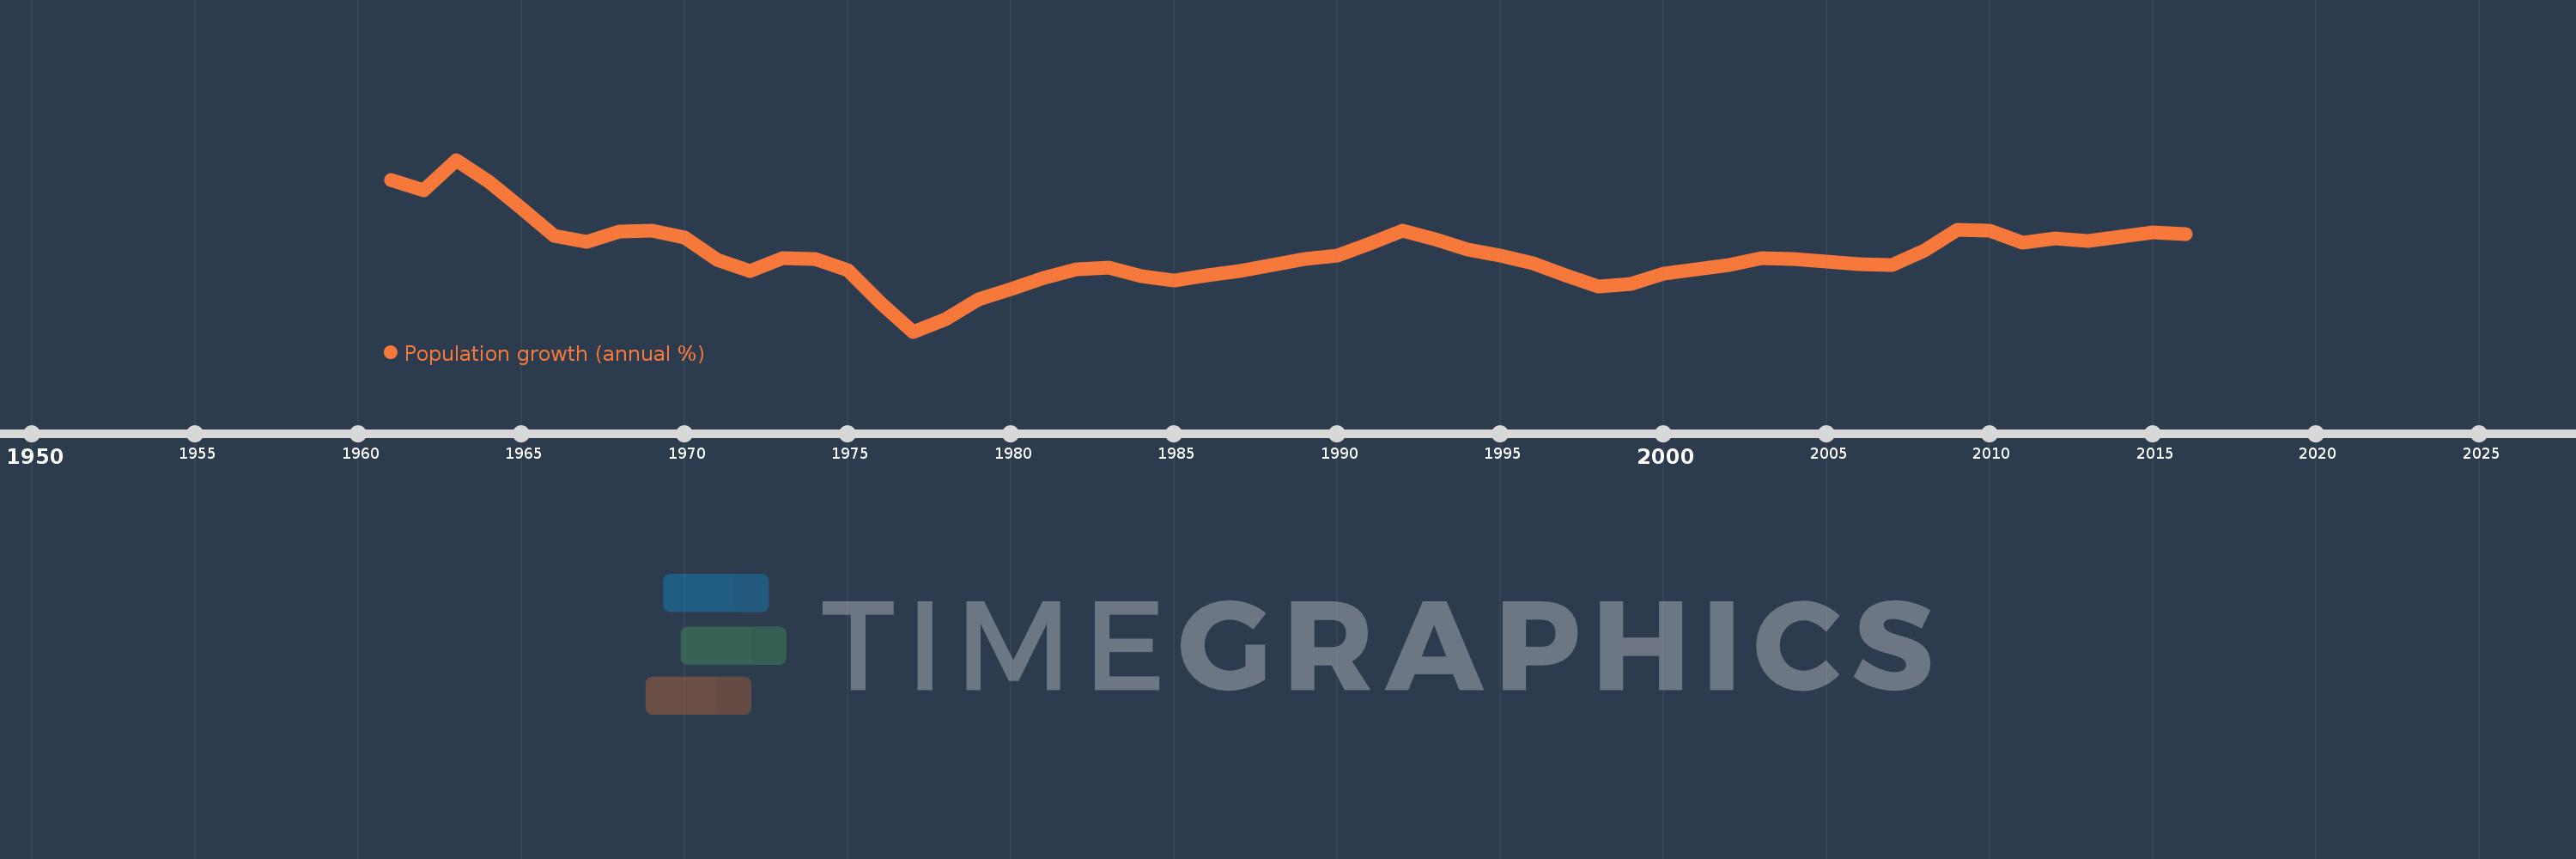
Population growth (annual %)
2016,2015,2014,2013,2012,2011,2010,2009,2008,2007,2006,2005,2004,2003,2002,2001,2000,1999,1998,1997,1996,1995,1994,1993,1992,1991,1990,1989,1988,1987,1986,1985,1984,1983,1982,1981,1980,1979,1978,1977,1976,1975,1974,1973,1972,1971,1970,1969,1968,1967,1966,1965,1964,1963,1962,1961
Estas estatísticas em outros países:
AfghanistanAlbaniaAlgeriaAmerican SamoaAndorraAngolaAntigua and BarbudaArab WorldArgentinaArmeniaArubaAustraliaAustriaAzerbaijanBahamas, TheBahrainBangladeshBarbadosBelarusBelgiumBelizeBeninBermudaBhutanBoliviaBosnia and HerzegovinaBotswanaBrazilBritish Virgin IslandsBrunei DarussalamBulgariaBurkina FasoBurundiCabo VerdeCambodiaCameroonCanadaCaribbean small statesCayman IslandsCentral African RepublicCentral Europe and the BalticsChadChannel IslandsChileChinaColombiaComorosCongo, Dem. Rep.Congo, Rep.Costa RicaCote d'IvoireCroatiaCubaCuracaoCyprusCzech RepublicDenmarkDjiboutiDominicaDominican RepublicEarly-demographic dividendEast Asia & PacificEast Asia & Pacific (excluding high income)East Asia & Pacific (IDA & IBRD countries)EcuadorEgypt, Arab Rep.El SalvadorEquatorial GuineaEritreaEstoniaEthiopiaEuro areaEurope & Central AsiaEurope & Central Asia (excluding high income)Europe & Central Asia (IDA & IBRD countries)European UnionFaroe IslandsFijiFinlandFragile and conflict affected situationsFranceFrench PolynesiaGabonGambia, TheGeorgiaGermanyGhanaGibraltarGreeceGreenlandGrenadaGuamGuatemalaGuineaGuinea-BissauGuyanaHaitiHeavily indebted poor countries (HIPC)High incomeHondurasHong Kong SAR, ChinaHungaryIBRD onlyIcelandIDA & IBRD totalIDA blendIDA onlyIDA totalIndiaIndonesiaIran, Islamic Rep.IraqIrelandIsle of ManIsraelItalyJamaicaJapanJordanKazakhstanKenyaKiribatiKorea, Dem. People’s Rep.Korea, Rep.KosovoKuwaitKyrgyz RepublicLao PDRLate-demographic dividendLatin America & Caribbean Latin America & Caribbean (excluding high income)Latin America & the Caribbean (IDA & IBRD countries)LatviaLeast developed countries: UN classificationLebanonLesothoLiberiaLibyaLiechtensteinLithuaniaLow & middle incomeLow incomeLower middle incomeLuxembourgMacao SAR, ChinaMacedonia, FYRMadagascarMalawiMalaysiaMaldivesMaliMaltaMarshall IslandsMauritaniaMauritiusMexicoMicronesia, Fed. Sts.Middle East & North AfricaMiddle East & North Africa (excluding high income)Middle East & North Africa (IDA & IBRD countries)Middle incomeMoldovaMonacoMongoliaMontenegroMoroccoMozambiqueMyanmarNamibiaNauruNepalNetherlandsNew CaledoniaNew ZealandNicaraguaNigerNigeriaNorth AmericaNorthern Mariana IslandsNorwayOECD membersOmanOther small statesPacific island small statesPakistanPalauPanamaPapua New GuineaParaguayPeruPhilippinesPolandPortugalPost-demographic dividendPre-demographic dividendPuerto RicoQatarRomaniaRussian FederationRwandaSamoaSan MarinoSao Tome and PrincipeSaudi ArabiaSenegalSerbiaSeychellesSierra LeoneSingaporeSint Maarten (Dutch part)Slovak RepublicSloveniaSmall statesSolomon IslandsSomaliaSouth AfricaSouth AsiaSouth Asia (IDA & IBRD)South SudanSpainSri LankaSt. Kitts and NevisSt. LuciaSt. Martin (French part)St. Vincent and the GrenadinesSub-Saharan Africa Sub-Saharan Africa (excluding high income)Sub-Saharan Africa (IDA & IBRD countries)SudanSurinameSwazilandSwedenSwitzerlandSyrian Arab RepublicTajikistanTanzaniaThailandTimor-LesteTogoTongaTrinidad and TobagoTunisiaTurkeyTurkmenistanTurks and Caicos IslandsTuvaluUgandaUkraineUnited Arab EmiratesUnited KingdomUnited StatesUpper middle incomeUruguayUzbekistanVanuatuVenezuela, RBVietnamVirgin Islands (U.S.)West Bank and GazaWorldYemen, Rep.ZambiaZimbabwe Linha do tempo:
Nesta escala de tempo está apresentado um gráfico de 1961 ano até 2016 ano Switzerland. Dados de 1960 ano ausente. O número de observações reais por data: 56.
Fonte (nome):
Indicadores de desenvolvimento mundial
Fonte (organização):
Derived from total population. Population source: (1) United Nations Population Division. World Population Prospects, (2) United Nations Statistical Division. Population and Vital Statistics Report (various years), (3) Census reports and other statistical
Categorias:
Climate Change, Health
Foi atualizado:
23 abr 2017 ano
Indicadores de alterações dos valores ao longo dos anos
Mínimo:
-0.572
1 jan 1977 ano
Máximo:
2.535
1 jan 1963 ano
Na data de observação
Valor
Mudança absoluta
A alteração em relação ao valor anterior
1 jan 1961 ano
2.172
+2.172
0.0%
1 jan 1962 ano
1.979
-0.194
-8.92%
1 jan 1963 ano
2.535
+0.556
28.12%
1 jan 1964 ano
2.138
-0.397
-15.67%
1 jan 1965 ano
1.654
-0.483
-22.61%
1 jan 1966 ano
1.155
-0.499
-30.19%
1 jan 1967 ano
1.045
-0.11
-9.5%
1 jan 1968 ano
1.239
+0.194
18.55%
1 jan 1969 ano
1.259
+0.02
1.63%
1 jan 1970 ano
1.125
-0.134
-10.63%
1 jan 1971 ano
0.722
-0.403
-35.81%
1 jan 1972 ano
0.525
-0.198
-27.35%
1 jan 1973 ano
0.762
+0.238
45.29%
1 jan 1974 ano
0.738
-0.024
-3.18%
1 jan 1975 ano
0.539
-0.2
-27.05%
1 jan 1976 ano
-0.044
-0.582
-108.12%
1 jan 1977 ano
-0.572
-0.528
1.21 mil%
1 jan 1978 ano
-0.339
+0.233
-40.69%
1 jan 1979 ano
0.009
+0.348
-102.65%
1 jan 1980 ano
0.201
+0.192
2.14 mil%
1 jan 1981 ano
0.397
+0.196
97.74%
1 jan 1982 ano
0.547
+0.15
37.77%
1 jan 1983 ano
0.584
+0.037
6.8%
1 jan 1984 ano
0.429
-0.156
-26.61%
1 jan 1985 ano
0.359
-0.07
-16.25%
1 jan 1986 ano
0.441
+0.082
22.93%
1 jan 1987 ano
0.52
+0.079
17.88%
1 jan 1988 ano
0.628
+0.108
20.7%
1 jan 1989 ano
0.735
+0.107
17.01%
1 jan 1990 ano
0.809
+0.074
10.01%
1 jan 1991 ano
1.027
+0.218
27.0%
1 jan 1992 ano
1.25
+0.223
21.71%
1 jan 1993 ano
1.103
-0.147
-11.79%
1 jan 1994 ano
0.911
-0.192
-17.4%
1 jan 1995 ano
0.797
-0.114
-12.47%
1 jan 1996 ano
0.668
-0.129
-16.17%
1 jan 1997 ano
0.442
-0.227
-33.91%
1 jan 1998 ano
0.241
-0.201
-45.45%
1 jan 1999 ano
0.297
+0.056
23.35%
1 jan 2000 ano
0.477
+0.18
60.51%
1 jan 2001 ano
0.562
+0.085
17.83%
1 jan 2002 ano
0.633
+0.071
12.6%
1 jan 2003 ano
0.756
+0.124
19.55%
1 jan 2004 ano
0.742
-0.015
-1.92%
1 jan 2005 ano
0.687
-0.054
-7.34%
1 jan 2006 ano
0.641
-0.047
-6.81%
1 jan 2007 ano
0.628
-0.013
-2.04%
1 jan 2008 ano
0.894
+0.266
42.41%
1 jan 2009 ano
1.271
+0.377
42.18%
1 jan 2010 ano
1.249
-0.021
-1.66%
1 jan 2011 ano
1.042
-0.208
-16.64%
1 jan 2012 ano
1.112
+0.07
6.75%
1 jan 2013 ano
1.062
-0.05
-4.5%
1 jan 2014 ano
1.15
+0.088
8.29%
1 jan 2015 ano
1.22
+0.07
6.11%
1 jan 2016 ano
1.194
-0.026
-2.17%
Classificação de países por estatísticas atuais por anos


Comentários: