29
/pt/
pt
AIzaSyAYiBZKx7MnpbEhh9jyipgxe19OcubqV5w
April 1, 2024
96595
Burundi
BDI
true
2
1
Population growth (annual %)
2016,2015,2014,2013,2012,2011,2010,2009,2008,2007,2006,2005,2004,2003,2002,2001,2000,1999,1998,1997,1996,1995,1994,1993,1992,1991,1990,1989,1988,1987,1986,1985,1984,1983,1982,1981,1980,1979,1978,1977,1976,1975,1974,1973,1972,1971,1970,1969,1968,1967,1966,1965,1964,1963,1962,1961
Estas estatísticas em outros países:
AfghanistanAlbaniaAlgeriaAmerican SamoaAndorraAngolaAntigua and BarbudaArab WorldArgentinaArmeniaArubaAustraliaAustriaAzerbaijanBahamas, TheBahrainBangladeshBarbadosBelarusBelgiumBelizeBeninBermudaBhutanBoliviaBosnia and HerzegovinaBotswanaBrazilBritish Virgin IslandsBrunei DarussalamBulgariaBurkina FasoBurundiCabo VerdeCambodiaCameroonCanadaCaribbean small statesCayman IslandsCentral African RepublicCentral Europe and the BalticsChadChannel IslandsChileChinaColombiaComorosCongo, Dem. Rep.Congo, Rep.Costa RicaCote d'IvoireCroatiaCubaCuracaoCyprusCzech RepublicDenmarkDjiboutiDominicaDominican RepublicEarly-demographic dividendEast Asia & PacificEast Asia & Pacific (excluding high income)East Asia & Pacific (IDA & IBRD countries)EcuadorEgypt, Arab Rep.El SalvadorEquatorial GuineaEritreaEstoniaEthiopiaEuro areaEurope & Central AsiaEurope & Central Asia (excluding high income)Europe & Central Asia (IDA & IBRD countries)European UnionFaroe IslandsFijiFinlandFragile and conflict affected situationsFranceFrench PolynesiaGabonGambia, TheGeorgiaGermanyGhanaGibraltarGreeceGreenlandGrenadaGuamGuatemalaGuineaGuinea-BissauGuyanaHaitiHeavily indebted poor countries (HIPC)High incomeHondurasHong Kong SAR, ChinaHungaryIBRD onlyIcelandIDA & IBRD totalIDA blendIDA onlyIDA totalIndiaIndonesiaIran, Islamic Rep.IraqIrelandIsle of ManIsraelItalyJamaicaJapanJordanKazakhstanKenyaKiribatiKorea, Dem. People’s Rep.Korea, Rep.KosovoKuwaitKyrgyz RepublicLao PDRLate-demographic dividendLatin America & Caribbean Latin America & Caribbean (excluding high income)Latin America & the Caribbean (IDA & IBRD countries)LatviaLeast developed countries: UN classificationLebanonLesothoLiberiaLibyaLiechtensteinLithuaniaLow & middle incomeLow incomeLower middle incomeLuxembourgMacao SAR, ChinaMacedonia, FYRMadagascarMalawiMalaysiaMaldivesMaliMaltaMarshall IslandsMauritaniaMauritiusMexicoMicronesia, Fed. Sts.Middle East & North AfricaMiddle East & North Africa (excluding high income)Middle East & North Africa (IDA & IBRD countries)Middle incomeMoldovaMonacoMongoliaMontenegroMoroccoMozambiqueMyanmarNamibiaNauruNepalNetherlandsNew CaledoniaNew ZealandNicaraguaNigerNigeriaNorth AmericaNorthern Mariana IslandsNorwayOECD membersOmanOther small statesPacific island small statesPakistanPalauPanamaPapua New GuineaParaguayPeruPhilippinesPolandPortugalPost-demographic dividendPre-demographic dividendPuerto RicoQatarRomaniaRussian FederationRwandaSamoaSan MarinoSao Tome and PrincipeSaudi ArabiaSenegalSerbiaSeychellesSierra LeoneSingaporeSint Maarten (Dutch part)Slovak RepublicSloveniaSmall statesSolomon IslandsSomaliaSouth AfricaSouth AsiaSouth Asia (IDA & IBRD)South SudanSpainSri LankaSt. Kitts and NevisSt. LuciaSt. Martin (French part)St. Vincent and the GrenadinesSub-Saharan Africa Sub-Saharan Africa (excluding high income)Sub-Saharan Africa (IDA & IBRD countries)SudanSurinameSwazilandSwedenSwitzerlandSyrian Arab RepublicTajikistanTanzaniaThailandTimor-LesteTogoTongaTrinidad and TobagoTunisiaTurkeyTurkmenistanTurks and Caicos IslandsTuvaluUgandaUkraineUnited Arab EmiratesUnited KingdomUnited StatesUpper middle incomeUruguayUzbekistanVanuatuVenezuela, RBVietnamVirgin Islands (U.S.)West Bank and GazaWorldYemen, Rep.ZambiaZimbabwe Linha do tempo:
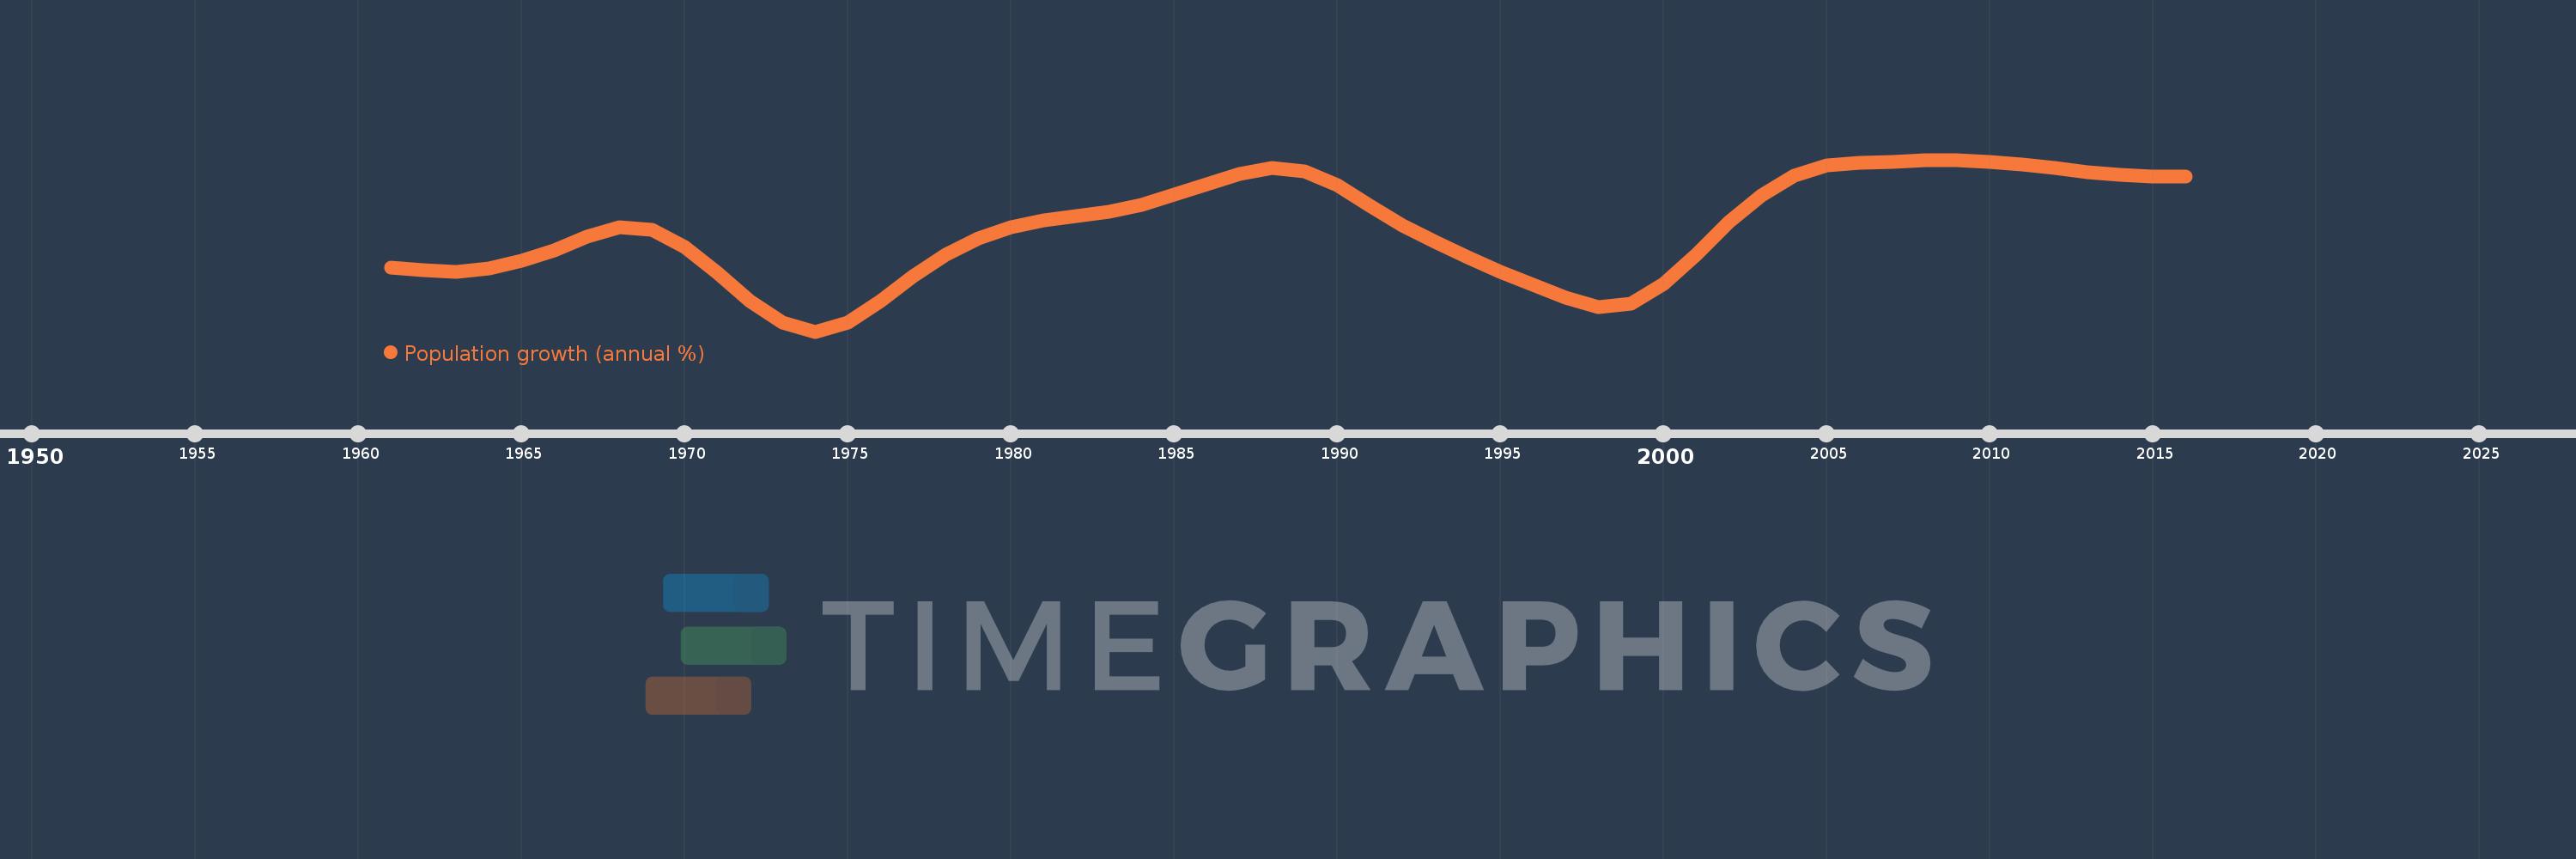
Nesta escala de tempo está apresentado um gráfico de 1961 ano até 2016 ano Burundi. Dados de 1960 ano ausente. O número de observações reais por data: 56.
Fonte (nome):
Indicadores de desenvolvimento mundial
Fonte (organização):
Derived from total population. Population source: (1) United Nations Population Division. World Population Prospects, (2) United Nations Statistical Division. Population and Vital Statistics Report (various years), (3) Census reports and other statistical
Categorias:
Climate Change, Health
Foi atualizado:
23 abr 2017 ano
Indicadores de alterações dos valores ao longo dos anos
Mínimo:
0.999
1 jan 1974 ano
Máximo:
3.545
1 jan 2009 ano
Na data de observação
Valor
Mudança absoluta
A alteração em relação ao valor anterior
1 jan 1961 ano
1.945
+1.945
0.0%
1 jan 1962 ano
1.906
-0.039
-2.01%
1 jan 1963 ano
1.888
-0.018
-0.96%
1 jan 1964 ano
1.93
+0.042
2.2%
1 jan 1965 ano
2.048
+0.118
6.13%
1 jan 1966 ano
2.203
+0.155
7.55%
1 jan 1967 ano
2.402
+0.199
9.04%
1 jan 1968 ano
2.543
+0.142
5.9%
1 jan 1969 ano
2.509
-0.035
-1.36%
1 jan 1970 ano
2.254
-0.254
-10.14%
1 jan 1971 ano
1.873
-0.381
-16.9%
1 jan 1972 ano
1.45
-0.424
-22.62%
1 jan 1973 ano
1.127
-0.323
-22.28%
1 jan 1974 ano
0.999
-0.128
-11.33%
1 jan 1975 ano
1.135
+0.136
13.62%
1 jan 1976 ano
1.456
+0.321
28.25%
1 jan 1977 ano
1.825
+0.369
25.34%
1 jan 1978 ano
2.134
+0.31
16.98%
1 jan 1979 ano
2.386
+0.252
11.79%
1 jan 1980 ano
2.547
+0.161
6.73%
1 jan 1981 ano
2.643
+0.096
3.76%
1 jan 1982 ano
2.705
+0.062
2.35%
1 jan 1983 ano
2.778
+0.074
2.73%
1 jan 1984 ano
2.883
+0.104
3.75%
1 jan 1985 ano
3.03
+0.147
5.09%
1 jan 1986 ano
3.185
+0.155
5.11%
1 jan 1987 ano
3.34
+0.156
4.89%
1 jan 1988 ano
3.428
+0.088
2.62%
1 jan 1989 ano
3.379
-0.049
-1.41%
1 jan 1990 ano
3.172
-0.207
-6.14%
1 jan 1991 ano
2.867
-0.305
-9.6%
1 jan 1992 ano
2.573
-0.295
-10.27%
1 jan 1993 ano
2.329
-0.244
-9.48%
1 jan 1994 ano
2.094
-0.234
-10.07%
1 jan 1995 ano
1.878
-0.216
-10.32%
1 jan 1996 ano
1.697
-0.181
-9.65%
1 jan 1997 ano
1.501
-0.196
-11.53%
1 jan 1998 ano
1.364
-0.137
-9.15%
1 jan 1999 ano
1.415
+0.051
3.77%
1 jan 2000 ano
1.702
+0.287
20.25%
1 jan 2001 ano
2.141
+0.439
25.81%
1 jan 2002 ano
2.62
+0.479
22.36%
1 jan 2003 ano
3.023
+0.403
15.37%
1 jan 2004 ano
3.315
+0.292
9.65%
1 jan 2005 ano
3.458
+0.143
4.32%
1 jan 2006 ano
3.496
+0.038
1.11%
1 jan 2007 ano
3.515
+0.019
0.54%
1 jan 2008 ano
3.544
+0.029
0.83%
1 jan 2009 ano
3.545
+0.0
0.0%
1 jan 2010 ano
3.519
-0.025
-0.71%
1 jan 2011 ano
3.477
-0.042
-1.19%
1 jan 2012 ano
3.419
-0.059
-1.68%
1 jan 2013 ano
3.359
-0.06
-1.75%
1 jan 2014 ano
3.316
-0.043
-1.27%
1 jan 2015 ano
3.298
-0.018
-0.56%
1 jan 2016 ano
3.292
-0.005
-0.16%
Classificação de países por estatísticas atuais por anos


Comentários: