29
/pt/
pt
AIzaSyAYiBZKx7MnpbEhh9jyipgxe19OcubqV5w
April 1, 2024
176889
Lebanon
LBN
true
2
1
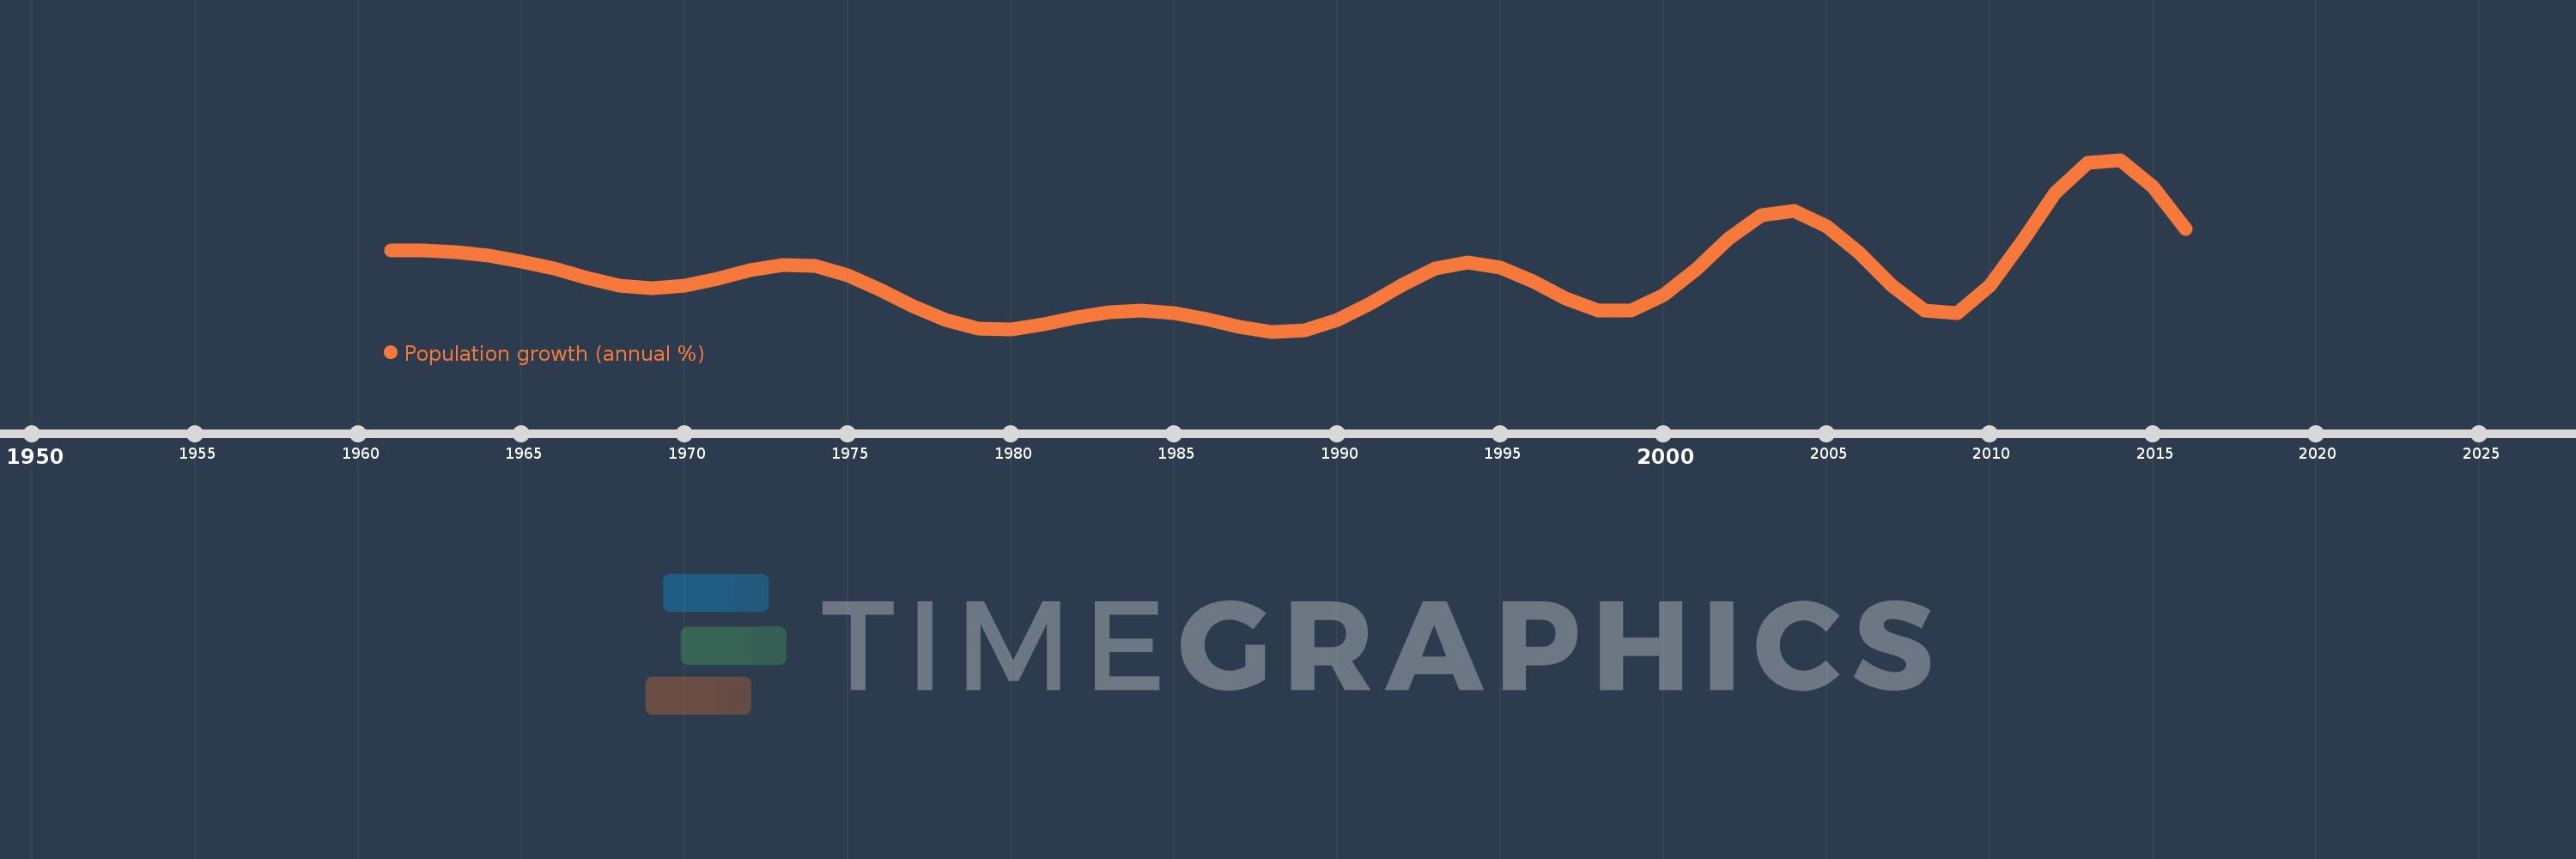
Population growth (annual %)
2016,2015,2014,2013,2012,2011,2010,2009,2008,2007,2006,2005,2004,2003,2002,2001,2000,1999,1998,1997,1996,1995,1994,1993,1992,1991,1990,1989,1988,1987,1986,1985,1984,1983,1982,1981,1980,1979,1978,1977,1976,1975,1974,1973,1972,1971,1970,1969,1968,1967,1966,1965,1964,1963,1962,1961
Estas estatísticas em outros países:
AfghanistanAlbaniaAlgeriaAmerican SamoaAndorraAngolaAntigua and BarbudaArab WorldArgentinaArmeniaArubaAustraliaAustriaAzerbaijanBahamas, TheBahrainBangladeshBarbadosBelarusBelgiumBelizeBeninBermudaBhutanBoliviaBosnia and HerzegovinaBotswanaBrazilBritish Virgin IslandsBrunei DarussalamBulgariaBurkina FasoBurundiCabo VerdeCambodiaCameroonCanadaCaribbean small statesCayman IslandsCentral African RepublicCentral Europe and the BalticsChadChannel IslandsChileChinaColombiaComorosCongo, Dem. Rep.Congo, Rep.Costa RicaCote d'IvoireCroatiaCubaCuracaoCyprusCzech RepublicDenmarkDjiboutiDominicaDominican RepublicEarly-demographic dividendEast Asia & PacificEast Asia & Pacific (excluding high income)East Asia & Pacific (IDA & IBRD countries)EcuadorEgypt, Arab Rep.El SalvadorEquatorial GuineaEritreaEstoniaEthiopiaEuro areaEurope & Central AsiaEurope & Central Asia (excluding high income)Europe & Central Asia (IDA & IBRD countries)European UnionFaroe IslandsFijiFinlandFragile and conflict affected situationsFranceFrench PolynesiaGabonGambia, TheGeorgiaGermanyGhanaGibraltarGreeceGreenlandGrenadaGuamGuatemalaGuineaGuinea-BissauGuyanaHaitiHeavily indebted poor countries (HIPC)High incomeHondurasHong Kong SAR, ChinaHungaryIBRD onlyIcelandIDA & IBRD totalIDA blendIDA onlyIDA totalIndiaIndonesiaIran, Islamic Rep.IraqIrelandIsle of ManIsraelItalyJamaicaJapanJordanKazakhstanKenyaKiribatiKorea, Dem. People’s Rep.Korea, Rep.KosovoKuwaitKyrgyz RepublicLao PDRLate-demographic dividendLatin America & Caribbean Latin America & Caribbean (excluding high income)Latin America & the Caribbean (IDA & IBRD countries)LatviaLeast developed countries: UN classificationLebanonLesothoLiberiaLibyaLiechtensteinLithuaniaLow & middle incomeLow incomeLower middle incomeLuxembourgMacao SAR, ChinaMacedonia, FYRMadagascarMalawiMalaysiaMaldivesMaliMaltaMarshall IslandsMauritaniaMauritiusMexicoMicronesia, Fed. Sts.Middle East & North AfricaMiddle East & North Africa (excluding high income)Middle East & North Africa (IDA & IBRD countries)Middle incomeMoldovaMonacoMongoliaMontenegroMoroccoMozambiqueMyanmarNamibiaNauruNepalNetherlandsNew CaledoniaNew ZealandNicaraguaNigerNigeriaNorth AmericaNorthern Mariana IslandsNorwayOECD membersOmanOther small statesPacific island small statesPakistanPalauPanamaPapua New GuineaParaguayPeruPhilippinesPolandPortugalPost-demographic dividendPre-demographic dividendPuerto RicoQatarRomaniaRussian FederationRwandaSamoaSan MarinoSao Tome and PrincipeSaudi ArabiaSenegalSerbiaSeychellesSierra LeoneSingaporeSint Maarten (Dutch part)Slovak RepublicSloveniaSmall statesSolomon IslandsSomaliaSouth AfricaSouth AsiaSouth Asia (IDA & IBRD)South SudanSpainSri LankaSt. Kitts and NevisSt. LuciaSt. Martin (French part)St. Vincent and the GrenadinesSub-Saharan Africa Sub-Saharan Africa (excluding high income)Sub-Saharan Africa (IDA & IBRD countries)SudanSurinameSwazilandSwedenSwitzerlandSyrian Arab RepublicTajikistanTanzaniaThailandTimor-LesteTogoTongaTrinidad and TobagoTunisiaTurkeyTurkmenistanTurks and Caicos IslandsTuvaluUgandaUkraineUnited Arab EmiratesUnited KingdomUnited StatesUpper middle incomeUruguayUzbekistanVanuatuVenezuela, RBVietnamVirgin Islands (U.S.)West Bank and GazaWorldYemen, Rep.ZambiaZimbabwe Linha do tempo:
Nesta escala de tempo está apresentado um gráfico de 1961 ano até 2016 ano Lebanon. Dados de 1960 ano ausente. O número de observações reais por data: 56.
Fonte (nome):
Indicadores de desenvolvimento mundial
Fonte (organização):
Derived from total population. Population source: (1) United Nations Population Division. World Population Prospects, (2) United Nations Statistical Division. Population and Vital Statistics Report (various years), (3) Census reports and other statistical
Categorias:
Climate Change, Health
Foi atualizado:
23 abr 2017 ano
Indicadores de alterações dos valores ao longo dos anos
Mínimo:
-0.191
1 jan 1988 ano
Máximo:
7.108
1 jan 2014 ano
Na data de observação
Valor
Mudança absoluta
A alteração em relação ao valor anterior
1 jan 1961 ano
3.253
+3.253
0.0%
1 jan 1962 ano
3.253
+0.0
0.01%
1 jan 1963 ano
3.202
-0.051
-1.56%
1 jan 1964 ano
3.054
-0.148
-4.62%
1 jan 1965 ano
2.793
-0.261
-8.53%
1 jan 1966 ano
2.475
-0.319
-11.41%
1 jan 1967 ano
2.094
-0.38
-15.36%
1 jan 1968 ano
1.773
-0.322
-15.37%
1 jan 1969 ano
1.647
-0.126
-7.08%
1 jan 1970 ano
1.777
+0.13
7.91%
1 jan 1971 ano
2.058
+0.281
15.79%
1 jan 1972 ano
2.415
+0.358
17.37%
1 jan 1973 ano
2.649
+0.233
9.66%
1 jan 1974 ano
2.601
-0.048
-1.81%
1 jan 1975 ano
2.196
-0.405
-15.56%
1 jan 1976 ano
1.573
-0.624
-28.39%
1 jan 1977 ano
0.876
-0.696
-44.28%
1 jan 1978 ano
0.302
-0.574
-65.52%
1 jan 1979 ano
-0.052
-0.354
-117.14%
1 jan 1980 ano
-0.088
-0.037
70.76%
1 jan 1981 ano
0.104
+0.193
-218.19%
1 jan 1982 ano
0.401
+0.296
283.41%
1 jan 1983 ano
0.63
+0.229
57.21%
1 jan 1984 ano
0.72
+0.09
14.27%
1 jan 1985 ano
0.599
-0.121
-16.75%
1 jan 1986 ano
0.35
-0.249
-41.51%
1 jan 1987 ano
0.026
-0.324
-92.57%
1 jan 1988 ano
-0.191
-0.217
-833.46%
1 jan 1989 ano
-0.134
+0.057
-29.62%
1 jan 1990 ano
0.3
+0.435
-323.33%
1 jan 1991 ano
0.982
+0.681
227.04%
1 jan 1992 ano
1.813
+0.831
84.7%
1 jan 1993 ano
2.49
+0.677
37.33%
1 jan 1994 ano
2.761
+0.271
10.88%
1 jan 1995 ano
2.512
-0.249
-9.02%
1 jan 1996 ano
1.956
-0.556
-22.12%
1 jan 1997 ano
1.231
-0.725
-37.07%
1 jan 1998 ano
0.704
-0.526
-42.77%
1 jan 1999 ano
0.686
-0.019
-2.68%
1 jan 2000 ano
1.362
+0.676
98.65%
1 jan 2001 ano
2.463
+1.101
80.85%
1 jan 2002 ano
3.776
+1.313
53.29%
1 jan 2003 ano
4.736
+0.961
25.44%
1 jan 2004 ano
4.946
+0.21
4.43%
1 jan 2005 ano
4.279
-0.667
-13.49%
1 jan 2006 ano
3.149
-1.129
-26.4%
1 jan 2007 ano
1.745
-1.404
-44.59%
1 jan 2008 ano
0.697
-1.048
-60.04%
1 jan 2009 ano
0.585
-0.112
-16.12%
1 jan 2010 ano
1.745
+1.161
198.44%
1 jan 2011 ano
3.649
+1.904
109.07%
1 jan 2012 ano
5.703
+2.054
56.29%
1 jan 2013 ano
6.992
+1.289
22.61%
1 jan 2014 ano
7.108
+0.115
1.65%
1 jan 2015 ano
5.968
-1.14
-16.04%
1 jan 2016 ano
4.164
-1.803
-30.21%
Classificação de países por estatísticas atuais por anos


Comentários: