29
/pt/
pt
AIzaSyAYiBZKx7MnpbEhh9jyipgxe19OcubqV5w
April 1, 2024
173346
Kyrgyz Republic
KGZ
true
2
1
Population growth (annual %)
2016,2015,2014,2013,2012,2011,2010,2009,2008,2007,2006,2005,2004,2003,2002,2001,2000,1999,1998,1997,1996,1995,1994,1993,1992,1991,1990,1989,1988,1987,1986,1985,1984,1983,1982,1981,1980,1979,1978,1977,1976,1975,1974,1973,1972,1971,1970,1969,1968,1967,1966,1965,1964,1963,1962,1961
Estas estatísticas em outros países:
AfghanistanAlbaniaAlgeriaAmerican SamoaAndorraAngolaAntigua and BarbudaArab WorldArgentinaArmeniaArubaAustraliaAustriaAzerbaijanBahamas, TheBahrainBangladeshBarbadosBelarusBelgiumBelizeBeninBermudaBhutanBoliviaBosnia and HerzegovinaBotswanaBrazilBritish Virgin IslandsBrunei DarussalamBulgariaBurkina FasoBurundiCabo VerdeCambodiaCameroonCanadaCaribbean small statesCayman IslandsCentral African RepublicCentral Europe and the BalticsChadChannel IslandsChileChinaColombiaComorosCongo, Dem. Rep.Congo, Rep.Costa RicaCote d'IvoireCroatiaCubaCuracaoCyprusCzech RepublicDenmarkDjiboutiDominicaDominican RepublicEarly-demographic dividendEast Asia & PacificEast Asia & Pacific (excluding high income)East Asia & Pacific (IDA & IBRD countries)EcuadorEgypt, Arab Rep.El SalvadorEquatorial GuineaEritreaEstoniaEthiopiaEuro areaEurope & Central AsiaEurope & Central Asia (excluding high income)Europe & Central Asia (IDA & IBRD countries)European UnionFaroe IslandsFijiFinlandFragile and conflict affected situationsFranceFrench PolynesiaGabonGambia, TheGeorgiaGermanyGhanaGibraltarGreeceGreenlandGrenadaGuamGuatemalaGuineaGuinea-BissauGuyanaHaitiHeavily indebted poor countries (HIPC)High incomeHondurasHong Kong SAR, ChinaHungaryIBRD onlyIcelandIDA & IBRD totalIDA blendIDA onlyIDA totalIndiaIndonesiaIran, Islamic Rep.IraqIrelandIsle of ManIsraelItalyJamaicaJapanJordanKazakhstanKenyaKiribatiKorea, Dem. People’s Rep.Korea, Rep.KosovoKuwaitKyrgyz RepublicLao PDRLate-demographic dividendLatin America & Caribbean Latin America & Caribbean (excluding high income)Latin America & the Caribbean (IDA & IBRD countries)LatviaLeast developed countries: UN classificationLebanonLesothoLiberiaLibyaLiechtensteinLithuaniaLow & middle incomeLow incomeLower middle incomeLuxembourgMacao SAR, ChinaMacedonia, FYRMadagascarMalawiMalaysiaMaldivesMaliMaltaMarshall IslandsMauritaniaMauritiusMexicoMicronesia, Fed. Sts.Middle East & North AfricaMiddle East & North Africa (excluding high income)Middle East & North Africa (IDA & IBRD countries)Middle incomeMoldovaMonacoMongoliaMontenegroMoroccoMozambiqueMyanmarNamibiaNauruNepalNetherlandsNew CaledoniaNew ZealandNicaraguaNigerNigeriaNorth AmericaNorthern Mariana IslandsNorwayOECD membersOmanOther small statesPacific island small statesPakistanPalauPanamaPapua New GuineaParaguayPeruPhilippinesPolandPortugalPost-demographic dividendPre-demographic dividendPuerto RicoQatarRomaniaRussian FederationRwandaSamoaSan MarinoSao Tome and PrincipeSaudi ArabiaSenegalSerbiaSeychellesSierra LeoneSingaporeSint Maarten (Dutch part)Slovak RepublicSloveniaSmall statesSolomon IslandsSomaliaSouth AfricaSouth AsiaSouth Asia (IDA & IBRD)South SudanSpainSri LankaSt. Kitts and NevisSt. LuciaSt. Martin (French part)St. Vincent and the GrenadinesSub-Saharan Africa Sub-Saharan Africa (excluding high income)Sub-Saharan Africa (IDA & IBRD countries)SudanSurinameSwazilandSwedenSwitzerlandSyrian Arab RepublicTajikistanTanzaniaThailandTimor-LesteTogoTongaTrinidad and TobagoTunisiaTurkeyTurkmenistanTurks and Caicos IslandsTuvaluUgandaUkraineUnited Arab EmiratesUnited KingdomUnited StatesUpper middle incomeUruguayUzbekistanVanuatuVenezuela, RBVietnamVirgin Islands (U.S.)West Bank and GazaWorldYemen, Rep.ZambiaZimbabwe Linha do tempo:
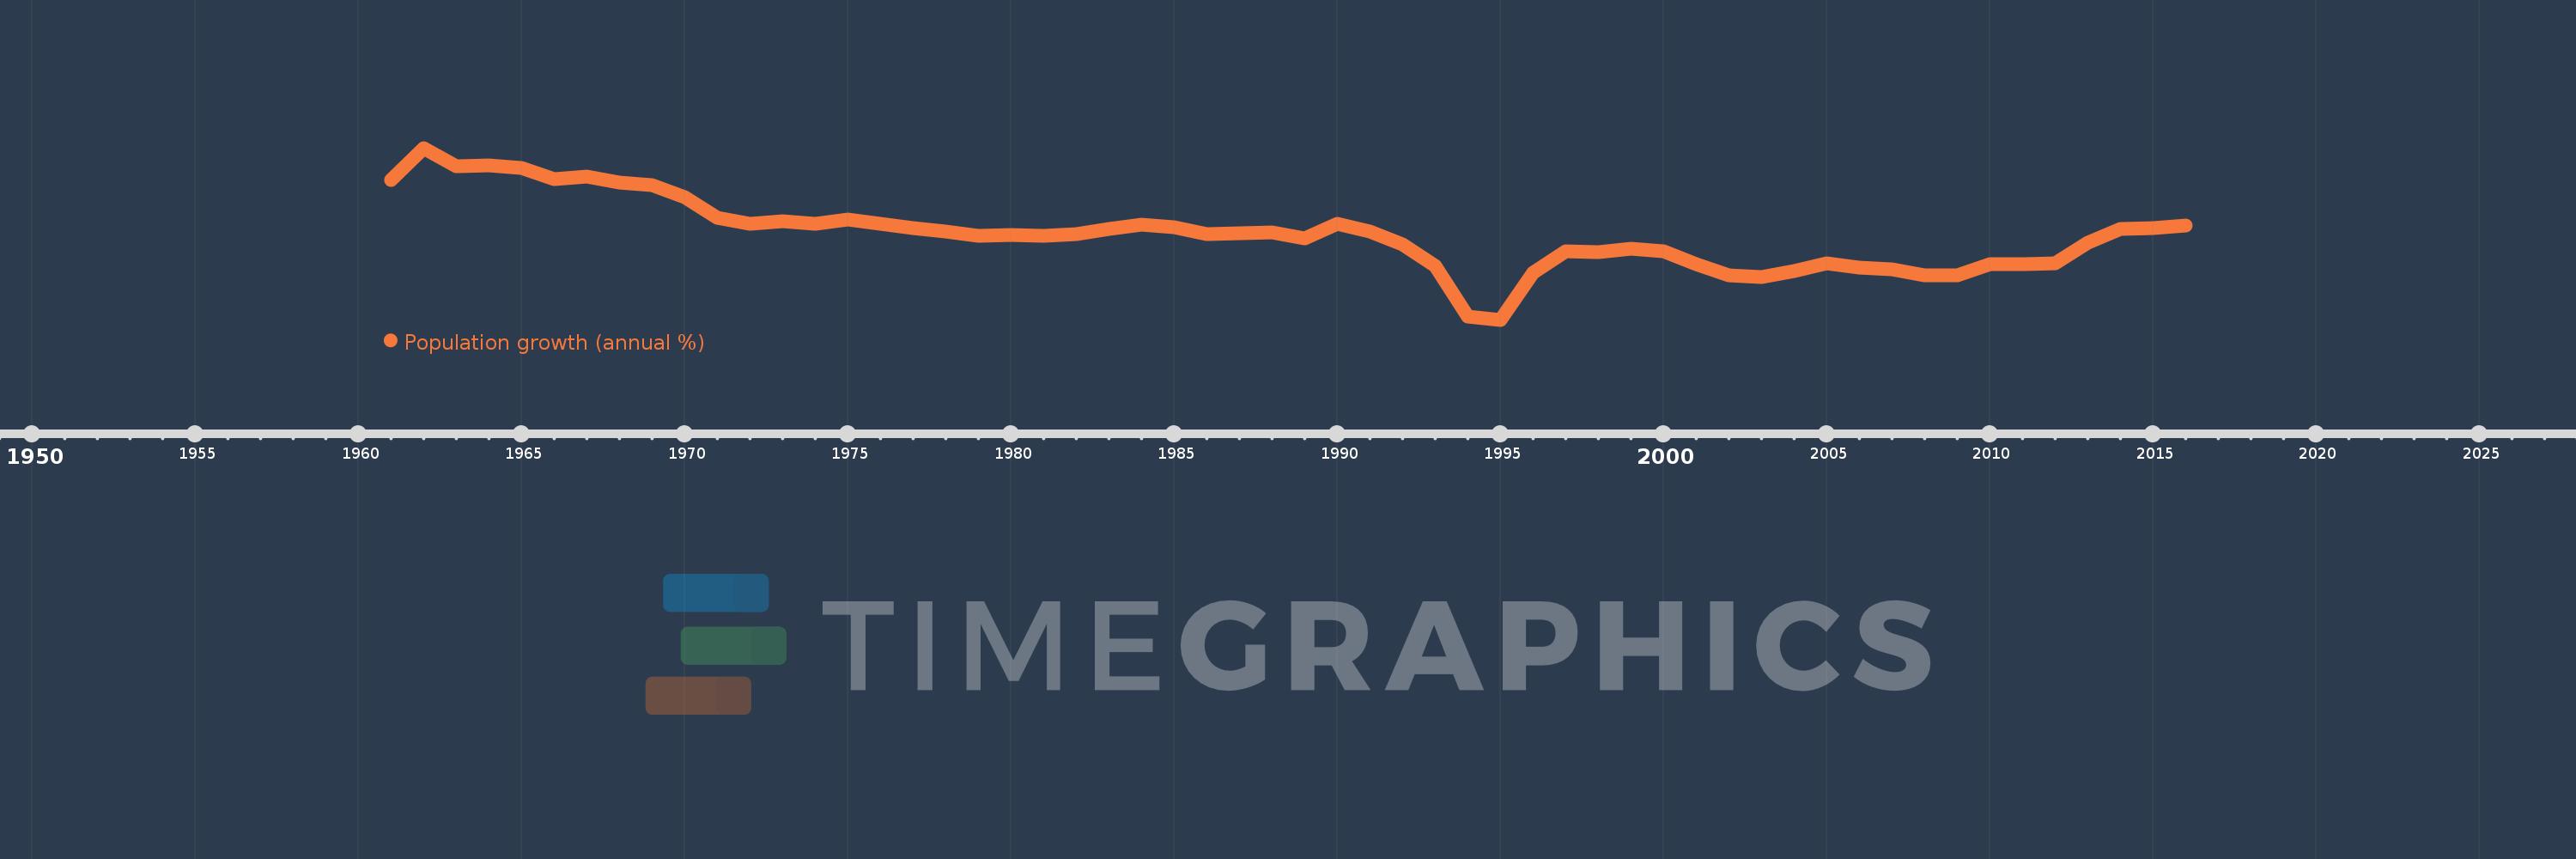
Nesta escala de tempo está apresentado um gráfico de 1961 ano até 2016 ano Kyrgyz Republic. Dados de 1960 ano ausente. O número de observações reais por data: 56.
Fonte (nome):
Indicadores de desenvolvimento mundial
Fonte (organização):
Derived from total population. Population source: (1) United Nations Population Division. World Population Prospects, (2) United Nations Statistical Division. Population and Vital Statistics Report (various years), (3) Census reports and other statistical
Categorias:
Climate Change, Health
Foi atualizado:
23 abr 2017 ano
Indicadores de alterações dos valores ao longo dos anos
Mínimo:
-0.035
1 jan 1995 ano
Máximo:
3.776
1 jan 1962 ano
Na data de observação
Valor
Mudança absoluta
A alteração em relação ao valor anterior
1 jan 1961 ano
3.062
+3.062
0.0%
1 jan 1962 ano
3.776
+0.714
23.33%
1 jan 1963 ano
3.378
-0.399
-10.55%
1 jan 1964 ano
3.383
+0.006
0.17%
1 jan 1965 ano
3.325
-0.059
-1.73%
1 jan 1966 ano
3.078
-0.247
-7.42%
1 jan 1967 ano
3.137
+0.059
1.91%
1 jan 1968 ano
3.012
-0.125
-3.97%
1 jan 1969 ano
2.945
-0.067
-2.22%
1 jan 1970 ano
2.678
-0.267
-9.07%
1 jan 1971 ano
2.224
-0.454
-16.96%
1 jan 1972 ano
2.086
-0.138
-6.19%
1 jan 1973 ano
2.157
+0.071
3.39%
1 jan 1974 ano
2.102
-0.055
-2.55%
1 jan 1975 ano
2.198
+0.096
4.59%
1 jan 1976 ano
2.102
-0.096
-4.36%
1 jan 1977 ano
1.994
-0.109
-5.17%
1 jan 1978 ano
1.923
-0.071
-3.57%
1 jan 1979 ano
1.829
-0.094
-4.87%
1 jan 1980 ano
1.844
+0.015
0.82%
1 jan 1981 ano
1.824
-0.02
-1.06%
1 jan 1982 ano
1.873
+0.049
2.67%
1 jan 1983 ano
1.975
+0.101
5.41%
1 jan 1984 ano
2.08
+0.105
5.33%
1 jan 1985 ano
2.014
-0.065
-3.14%
1 jan 1986 ano
1.869
-0.145
-7.2%
1 jan 1987 ano
1.892
+0.022
1.19%
1 jan 1988 ano
1.902
+0.011
0.57%
1 jan 1989 ano
1.765
-0.137
-7.22%
1 jan 1990 ano
2.09
+0.325
18.43%
1 jan 1991 ano
1.924
-0.166
-7.93%
1 jan 1992 ano
1.635
-0.289
-15.03%
1 jan 1993 ano
1.154
-0.481
-29.44%
1 jan 1994 ano
0.029
-1.125
-97.51%
1 jan 1995 ano
-0.035
-0.064
-223.08%
1 jan 1996 ano
0.998
+1.034
-2.92 mil%
1 jan 1997 ano
1.48
+0.482
48.26%
1 jan 1998 ano
1.459
-0.022
-1.46%
1 jan 1999 ano
1.534
+0.076
5.18%
1 jan 2000 ano
1.486
-0.048
-3.13%
1 jan 2001 ano
1.191
-0.295
-19.85%
1 jan 2002 ano
0.949
-0.242
-20.34%
1 jan 2003 ano
0.918
-0.031
-3.26%
1 jan 2004 ano
1.048
+0.131
14.22%
1 jan 2005 ano
1.21
+0.162
15.42%
1 jan 2006 ano
1.128
-0.082
-6.8%
1 jan 2007 ano
1.075
-0.053
-4.68%
1 jan 2008 ano
0.954
-0.121
-11.3%
1 jan 2009 ano
0.95
-0.003
-0.35%
1 jan 2010 ano
1.207
+0.257
27.05%
1 jan 2011 ano
1.193
-0.014
-1.19%
1 jan 2012 ano
1.217
+0.024
2.01%
1 jan 2013 ano
1.665
+0.448
36.84%
1 jan 2014 ano
1.985
+0.32
19.19%
1 jan 2015 ano
2.006
+0.021
1.08%
1 jan 2016 ano
2.061
+0.055
2.72%
Classificação de países por estatísticas atuais por anos


Comentários: