29
/pt/
pt
AIzaSyAYiBZKx7MnpbEhh9jyipgxe19OcubqV5w
April 1, 2024
208326
Netherlands
NLD
true
2
1
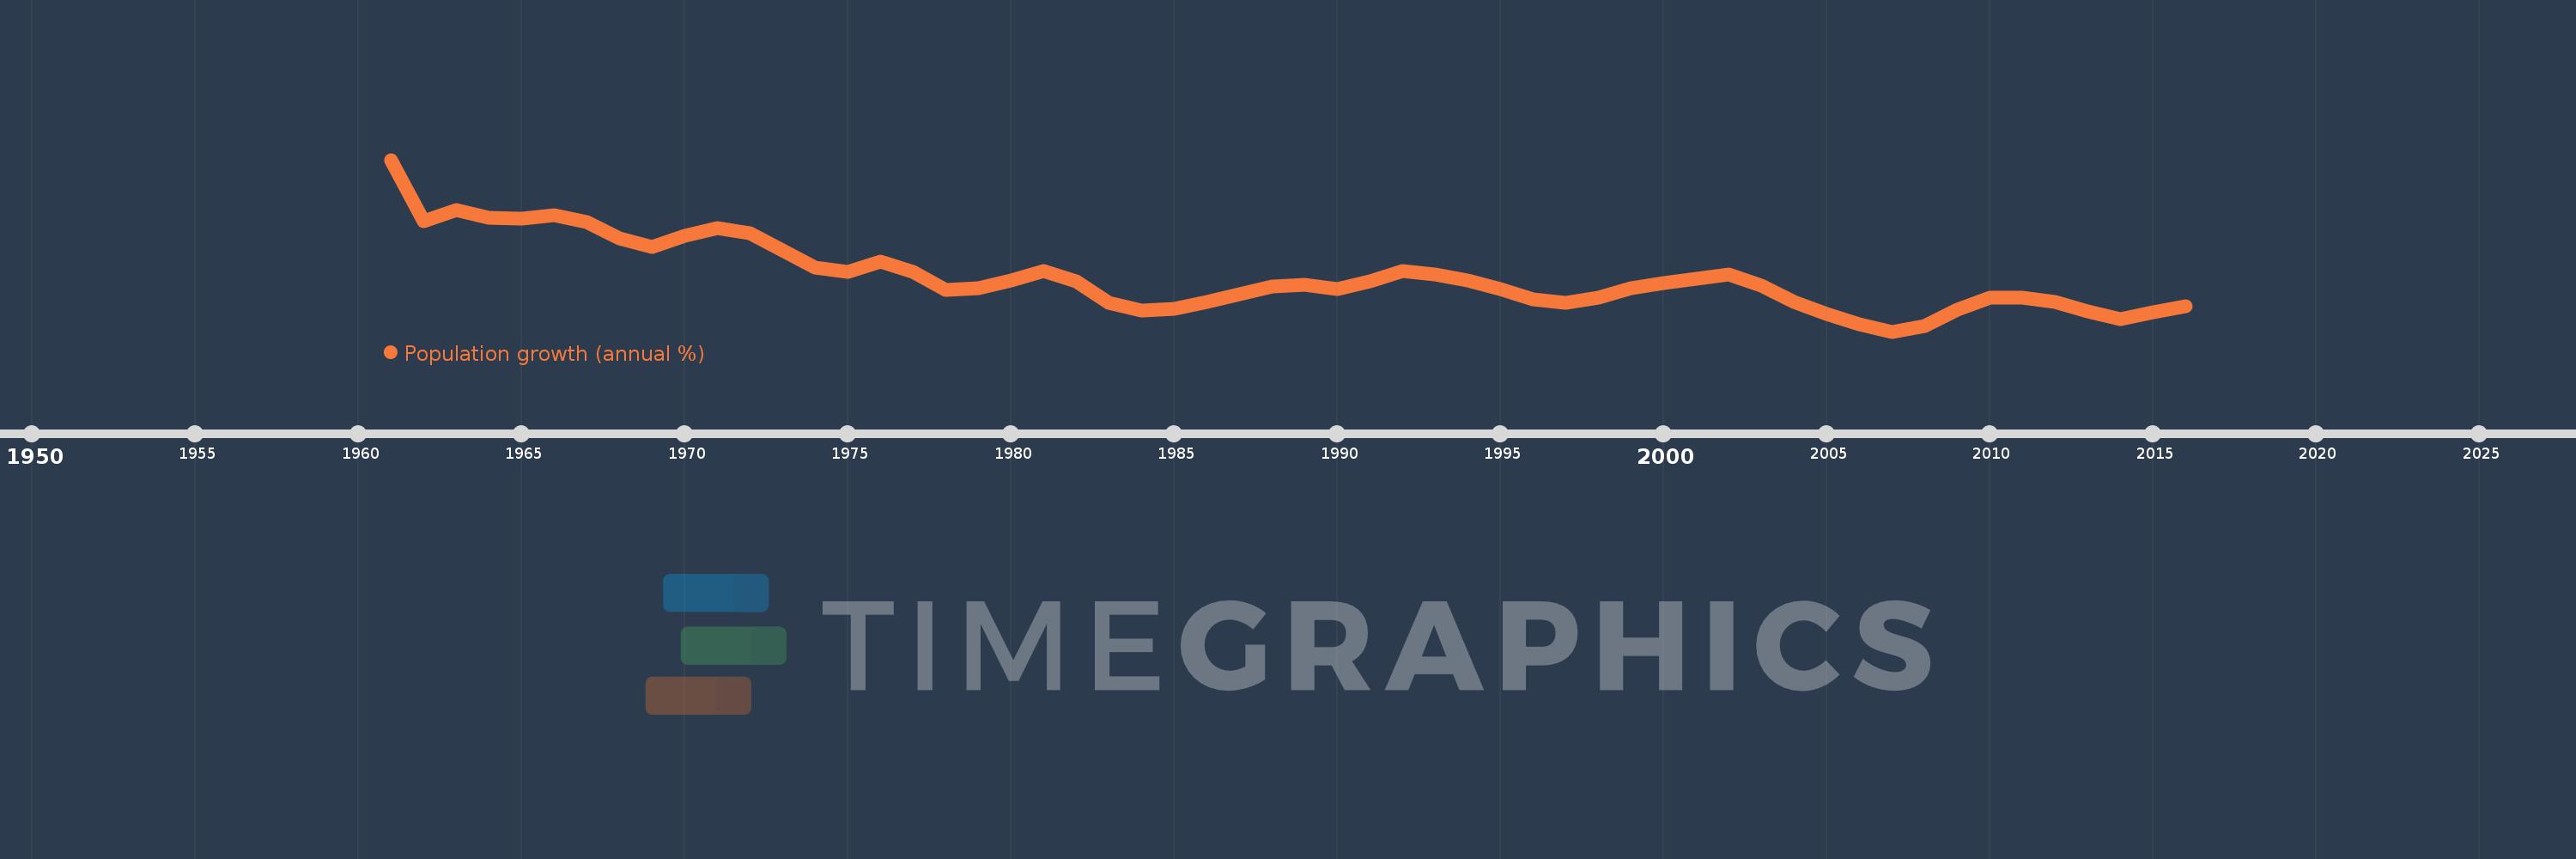
Population growth (annual %)
2016,2015,2014,2013,2012,2011,2010,2009,2008,2007,2006,2005,2004,2003,2002,2001,2000,1999,1998,1997,1996,1995,1994,1993,1992,1991,1990,1989,1988,1987,1986,1985,1984,1983,1982,1981,1980,1979,1978,1977,1976,1975,1974,1973,1972,1971,1970,1969,1968,1967,1966,1965,1964,1963,1962,1961
Estas estatísticas em outros países:
AfghanistanAlbaniaAlgeriaAmerican SamoaAndorraAngolaAntigua and BarbudaArab WorldArgentinaArmeniaArubaAustraliaAustriaAzerbaijanBahamas, TheBahrainBangladeshBarbadosBelarusBelgiumBelizeBeninBermudaBhutanBoliviaBosnia and HerzegovinaBotswanaBrazilBritish Virgin IslandsBrunei DarussalamBulgariaBurkina FasoBurundiCabo VerdeCambodiaCameroonCanadaCaribbean small statesCayman IslandsCentral African RepublicCentral Europe and the BalticsChadChannel IslandsChileChinaColombiaComorosCongo, Dem. Rep.Congo, Rep.Costa RicaCote d'IvoireCroatiaCubaCuracaoCyprusCzech RepublicDenmarkDjiboutiDominicaDominican RepublicEarly-demographic dividendEast Asia & PacificEast Asia & Pacific (excluding high income)East Asia & Pacific (IDA & IBRD countries)EcuadorEgypt, Arab Rep.El SalvadorEquatorial GuineaEritreaEstoniaEthiopiaEuro areaEurope & Central AsiaEurope & Central Asia (excluding high income)Europe & Central Asia (IDA & IBRD countries)European UnionFaroe IslandsFijiFinlandFragile and conflict affected situationsFranceFrench PolynesiaGabonGambia, TheGeorgiaGermanyGhanaGibraltarGreeceGreenlandGrenadaGuamGuatemalaGuineaGuinea-BissauGuyanaHaitiHeavily indebted poor countries (HIPC)High incomeHondurasHong Kong SAR, ChinaHungaryIBRD onlyIcelandIDA & IBRD totalIDA blendIDA onlyIDA totalIndiaIndonesiaIran, Islamic Rep.IraqIrelandIsle of ManIsraelItalyJamaicaJapanJordanKazakhstanKenyaKiribatiKorea, Dem. People’s Rep.Korea, Rep.KosovoKuwaitKyrgyz RepublicLao PDRLate-demographic dividendLatin America & Caribbean Latin America & Caribbean (excluding high income)Latin America & the Caribbean (IDA & IBRD countries)LatviaLeast developed countries: UN classificationLebanonLesothoLiberiaLibyaLiechtensteinLithuaniaLow & middle incomeLow incomeLower middle incomeLuxembourgMacao SAR, ChinaMacedonia, FYRMadagascarMalawiMalaysiaMaldivesMaliMaltaMarshall IslandsMauritaniaMauritiusMexicoMicronesia, Fed. Sts.Middle East & North AfricaMiddle East & North Africa (excluding high income)Middle East & North Africa (IDA & IBRD countries)Middle incomeMoldovaMonacoMongoliaMontenegroMoroccoMozambiqueMyanmarNamibiaNauruNepalNetherlandsNew CaledoniaNew ZealandNicaraguaNigerNigeriaNorth AmericaNorthern Mariana IslandsNorwayOECD membersOmanOther small statesPacific island small statesPakistanPalauPanamaPapua New GuineaParaguayPeruPhilippinesPolandPortugalPost-demographic dividendPre-demographic dividendPuerto RicoQatarRomaniaRussian FederationRwandaSamoaSan MarinoSao Tome and PrincipeSaudi ArabiaSenegalSerbiaSeychellesSierra LeoneSingaporeSint Maarten (Dutch part)Slovak RepublicSloveniaSmall statesSolomon IslandsSomaliaSouth AfricaSouth AsiaSouth Asia (IDA & IBRD)South SudanSpainSri LankaSt. Kitts and NevisSt. LuciaSt. Martin (French part)St. Vincent and the GrenadinesSub-Saharan Africa Sub-Saharan Africa (excluding high income)Sub-Saharan Africa (IDA & IBRD countries)SudanSurinameSwazilandSwedenSwitzerlandSyrian Arab RepublicTajikistanTanzaniaThailandTimor-LesteTogoTongaTrinidad and TobagoTunisiaTurkeyTurkmenistanTurks and Caicos IslandsTuvaluUgandaUkraineUnited Arab EmiratesUnited KingdomUnited StatesUpper middle incomeUruguayUzbekistanVanuatuVenezuela, RBVietnamVirgin Islands (U.S.)West Bank and GazaWorldYemen, Rep.ZambiaZimbabwe Linha do tempo:
Nesta escala de tempo está apresentado um gráfico de 1961 ano até 2016 ano Netherlands. Dados de 1960 ano ausente. O número de observações reais por data: 56.
Fonte (nome):
Indicadores de desenvolvimento mundial
Fonte (organização):
Derived from total population. Population source: (1) United Nations Population Division. World Population Prospects, (2) United Nations Statistical Division. Population and Vital Statistics Report (various years), (3) Census reports and other statistical
Categorias:
Climate Change, Health
Foi atualizado:
23 abr 2017 ano
Indicadores de alterações dos valores ao longo dos anos
Mínimo:
0.161
1 jan 2007 ano
Máximo:
1.952
1 jan 1961 ano
Na data de observação
Valor
Mudança absoluta
A alteração em relação ao valor anterior
1 jan 1961 ano
1.952
+1.952
0.0%
1 jan 1962 ano
1.315
-0.637
-32.62%
1 jan 1963 ano
1.424
+0.109
8.3%
1 jan 1964 ano
1.348
-0.076
-5.33%
1 jan 1965 ano
1.338
-0.011
-0.79%
1 jan 1966 ano
1.373
+0.035
2.61%
1 jan 1967 ano
1.305
-0.067
-4.92%
1 jan 1968 ano
1.133
-0.172
-13.18%
1 jan 1969 ano
1.039
-0.095
-8.35%
1 jan 1970 ano
1.158
+0.119
11.5%
1 jan 1971 ano
1.239
+0.081
6.99%
1 jan 1972 ano
1.189
-0.05
-4.02%
1 jan 1973 ano
1.011
-0.178
-14.97%
1 jan 1974 ano
0.827
-0.184
-18.18%
1 jan 1975 ano
0.784
-0.044
-5.28%
1 jan 1976 ano
0.891
+0.108
13.75%
1 jan 1977 ano
0.785
-0.106
-11.94%
1 jan 1978 ano
0.595
-0.19
-24.25%
1 jan 1979 ano
0.615
+0.021
3.47%
1 jan 1980 ano
0.69
+0.075
12.19%
1 jan 1981 ano
0.791
+0.101
14.64%
1 jan 1982 ano
0.686
-0.105
-13.3%
1 jan 1983 ano
0.459
-0.227
-33.16%
1 jan 1984 ano
0.379
-0.079
-17.3%
1 jan 1985 ano
0.397
+0.018
4.67%
1 jan 1986 ano
0.466
+0.069
17.48%
1 jan 1987 ano
0.555
+0.089
19.01%
1 jan 1988 ano
0.635
+0.08
14.34%
1 jan 1989 ano
0.646
+0.012
1.82%
1 jan 1990 ano
0.6
-0.046
-7.15%
1 jan 1991 ano
0.689
+0.089
14.79%
1 jan 1992 ano
0.788
+0.099
14.44%
1 jan 1993 ano
0.756
-0.032
-4.06%
1 jan 1994 ano
0.697
-0.059
-7.81%
1 jan 1995 ano
0.603
-0.094
-13.49%
1 jan 1996 ano
0.494
-0.109
-18.08%
1 jan 1997 ano
0.461
-0.033
-6.59%
1 jan 1998 ano
0.515
+0.053
11.57%
1 jan 1999 ano
0.617
+0.102
19.79%
1 jan 2000 ano
0.665
+0.049
7.92%
1 jan 2001 ano
0.715
+0.049
7.4%
1 jan 2002 ano
0.755
+0.04
5.61%
1 jan 2003 ano
0.638
-0.117
-15.44%
1 jan 2004 ano
0.472
-0.166
-26.08%
1 jan 2005 ano
0.347
-0.124
-26.35%
1 jan 2006 ano
0.234
-0.114
-32.75%
1 jan 2007 ano
0.161
-0.073
-31.26%
1 jan 2008 ano
0.218
+0.057
35.43%
1 jan 2009 ano
0.389
+0.172
78.97%
1 jan 2010 ano
0.514
+0.125
32.11%
1 jan 2011 ano
0.513
-0.001
-0.26%
1 jan 2012 ano
0.466
-0.046
-9.06%
1 jan 2013 ano
0.37
-0.096
-20.66%
1 jan 2014 ano
0.295
-0.075
-20.33%
1 jan 2015 ano
0.36
+0.065
22.05%
1 jan 2016 ano
0.423
+0.063
17.59%
Classificação de países por estatísticas atuais por anos


Comentários: