29
/pt/
pt
AIzaSyAYiBZKx7MnpbEhh9jyipgxe19OcubqV5w
April 1, 2024
90281
Botswana
BWA
true
2
1
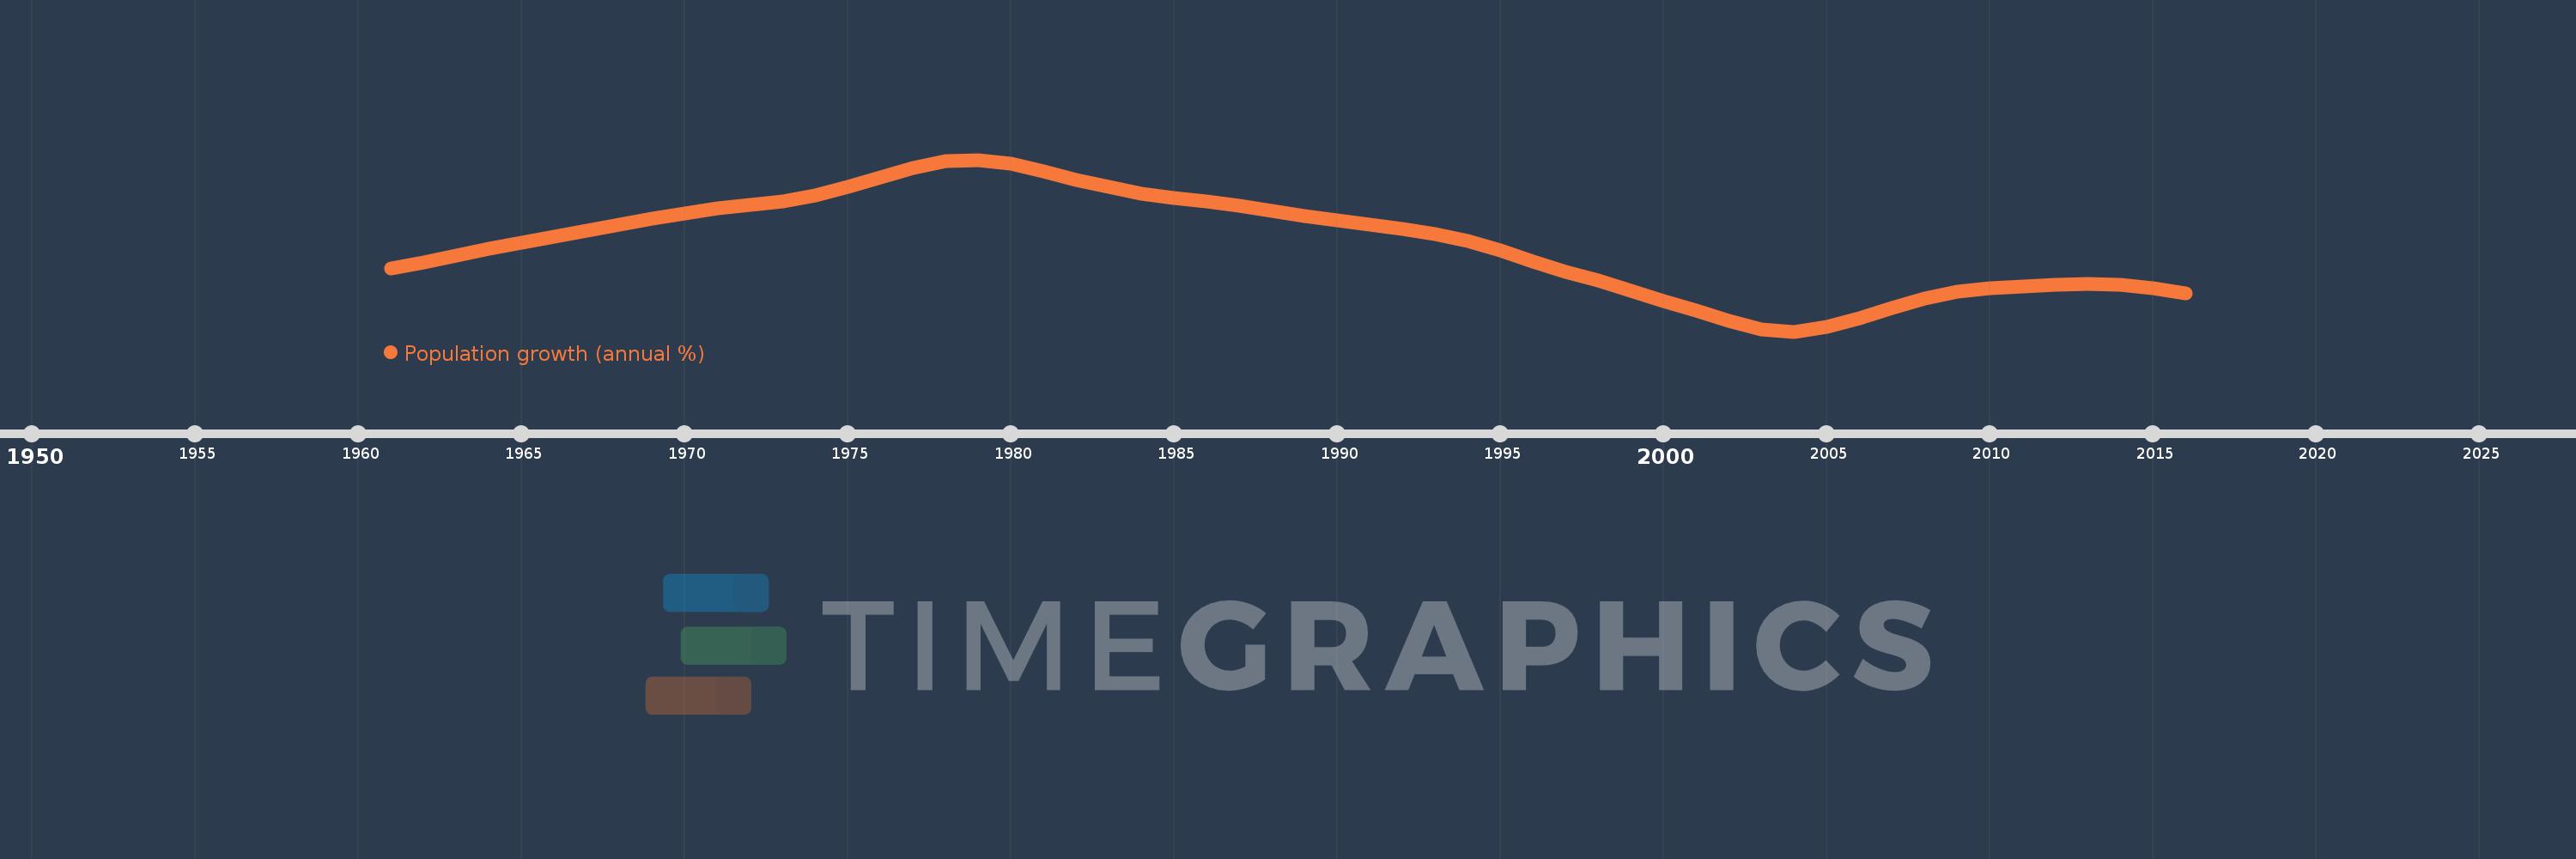
Population growth (annual %)
2016,2015,2014,2013,2012,2011,2010,2009,2008,2007,2006,2005,2004,2003,2002,2001,2000,1999,1998,1997,1996,1995,1994,1993,1992,1991,1990,1989,1988,1987,1986,1985,1984,1983,1982,1981,1980,1979,1978,1977,1976,1975,1974,1973,1972,1971,1970,1969,1968,1967,1966,1965,1964,1963,1962,1961
Estas estatísticas em outros países:
AfghanistanAlbaniaAlgeriaAmerican SamoaAndorraAngolaAntigua and BarbudaArab WorldArgentinaArmeniaArubaAustraliaAustriaAzerbaijanBahamas, TheBahrainBangladeshBarbadosBelarusBelgiumBelizeBeninBermudaBhutanBoliviaBosnia and HerzegovinaBotswanaBrazilBritish Virgin IslandsBrunei DarussalamBulgariaBurkina FasoBurundiCabo VerdeCambodiaCameroonCanadaCaribbean small statesCayman IslandsCentral African RepublicCentral Europe and the BalticsChadChannel IslandsChileChinaColombiaComorosCongo, Dem. Rep.Congo, Rep.Costa RicaCote d'IvoireCroatiaCubaCuracaoCyprusCzech RepublicDenmarkDjiboutiDominicaDominican RepublicEarly-demographic dividendEast Asia & PacificEast Asia & Pacific (excluding high income)East Asia & Pacific (IDA & IBRD countries)EcuadorEgypt, Arab Rep.El SalvadorEquatorial GuineaEritreaEstoniaEthiopiaEuro areaEurope & Central AsiaEurope & Central Asia (excluding high income)Europe & Central Asia (IDA & IBRD countries)European UnionFaroe IslandsFijiFinlandFragile and conflict affected situationsFranceFrench PolynesiaGabonGambia, TheGeorgiaGermanyGhanaGibraltarGreeceGreenlandGrenadaGuamGuatemalaGuineaGuinea-BissauGuyanaHaitiHeavily indebted poor countries (HIPC)High incomeHondurasHong Kong SAR, ChinaHungaryIBRD onlyIcelandIDA & IBRD totalIDA blendIDA onlyIDA totalIndiaIndonesiaIran, Islamic Rep.IraqIrelandIsle of ManIsraelItalyJamaicaJapanJordanKazakhstanKenyaKiribatiKorea, Dem. People’s Rep.Korea, Rep.KosovoKuwaitKyrgyz RepublicLao PDRLate-demographic dividendLatin America & Caribbean Latin America & Caribbean (excluding high income)Latin America & the Caribbean (IDA & IBRD countries)LatviaLeast developed countries: UN classificationLebanonLesothoLiberiaLibyaLiechtensteinLithuaniaLow & middle incomeLow incomeLower middle incomeLuxembourgMacao SAR, ChinaMacedonia, FYRMadagascarMalawiMalaysiaMaldivesMaliMaltaMarshall IslandsMauritaniaMauritiusMexicoMicronesia, Fed. Sts.Middle East & North AfricaMiddle East & North Africa (excluding high income)Middle East & North Africa (IDA & IBRD countries)Middle incomeMoldovaMonacoMongoliaMontenegroMoroccoMozambiqueMyanmarNamibiaNauruNepalNetherlandsNew CaledoniaNew ZealandNicaraguaNigerNigeriaNorth AmericaNorthern Mariana IslandsNorwayOECD membersOmanOther small statesPacific island small statesPakistanPalauPanamaPapua New GuineaParaguayPeruPhilippinesPolandPortugalPost-demographic dividendPre-demographic dividendPuerto RicoQatarRomaniaRussian FederationRwandaSamoaSan MarinoSao Tome and PrincipeSaudi ArabiaSenegalSerbiaSeychellesSierra LeoneSingaporeSint Maarten (Dutch part)Slovak RepublicSloveniaSmall statesSolomon IslandsSomaliaSouth AfricaSouth AsiaSouth Asia (IDA & IBRD)South SudanSpainSri LankaSt. Kitts and NevisSt. LuciaSt. Martin (French part)St. Vincent and the GrenadinesSub-Saharan Africa Sub-Saharan Africa (excluding high income)Sub-Saharan Africa (IDA & IBRD countries)SudanSurinameSwazilandSwedenSwitzerlandSyrian Arab RepublicTajikistanTanzaniaThailandTimor-LesteTogoTongaTrinidad and TobagoTunisiaTurkeyTurkmenistanTurks and Caicos IslandsTuvaluUgandaUkraineUnited Arab EmiratesUnited KingdomUnited StatesUpper middle incomeUruguayUzbekistanVanuatuVenezuela, RBVietnamVirgin Islands (U.S.)West Bank and GazaWorldYemen, Rep.ZambiaZimbabwe Linha do tempo:
Nesta escala de tempo está apresentado um gráfico de 1961 ano até 2016 ano Botswana. Dados de 1960 ano ausente. O número de observações reais por data: 56.
Fonte (nome):
Indicadores de desenvolvimento mundial
Fonte (organização):
Derived from total population. Population source: (1) United Nations Population Division. World Population Prospects, (2) United Nations Statistical Division. Population and Vital Statistics Report (various years), (3) Census reports and other statistical
Categorias:
Climate Change, Health
Foi atualizado:
23 abr 2017 ano
Indicadores de alterações dos valores ao longo dos anos
Mínimo:
1.321
1 jan 2004 ano
Máximo:
3.922
1 jan 1979 ano
Na data de observação
Valor
Mudança absoluta
A alteração em relação ao valor anterior
1 jan 1961 ano
2.272
+2.272
0.0%
1 jan 1962 ano
2.366
+0.094
4.13%
1 jan 1963 ano
2.469
+0.103
4.36%
1 jan 1964 ano
2.571
+0.102
4.14%
1 jan 1965 ano
2.665
+0.094
3.66%
1 jan 1966 ano
2.754
+0.088
3.31%
1 jan 1967 ano
2.848
+0.094
3.42%
1 jan 1968 ano
2.946
+0.098
3.45%
1 jan 1969 ano
3.035
+0.089
3.03%
1 jan 1970 ano
3.113
+0.078
2.56%
1 jan 1971 ano
3.184
+0.071
2.27%
1 jan 1972 ano
3.236
+0.052
1.63%
1 jan 1973 ano
3.29
+0.055
1.69%
1 jan 1974 ano
3.379
+0.089
2.7%
1 jan 1975 ano
3.51
+0.131
3.88%
1 jan 1976 ano
3.657
+0.147
4.17%
1 jan 1977 ano
3.799
+0.142
3.9%
1 jan 1978 ano
3.897
+0.098
2.58%
1 jan 1979 ano
3.922
+0.025
0.64%
1 jan 1980 ano
3.863
-0.06
-1.52%
1 jan 1981 ano
3.749
-0.113
-2.93%
1 jan 1982 ano
3.621
-0.128
-3.42%
1 jan 1983 ano
3.509
-0.113
-3.12%
1 jan 1984 ano
3.412
-0.096
-2.74%
1 jan 1985 ano
3.341
-0.071
-2.09%
1 jan 1986 ano
3.285
-0.056
-1.68%
1 jan 1987 ano
3.221
-0.064
-1.93%
1 jan 1988 ano
3.147
-0.075
-2.32%
1 jan 1989 ano
3.076
-0.071
-2.26%
1 jan 1990 ano
3.009
-0.066
-2.16%
1 jan 1991 ano
2.942
-0.067
-2.23%
1 jan 1992 ano
2.878
-0.064
-2.18%
1 jan 1993 ano
2.802
-0.076
-2.63%
1 jan 1994 ano
2.696
-0.107
-3.8%
1 jan 1995 ano
2.552
-0.144
-5.33%
1 jan 1996 ano
2.385
-0.166
-6.52%
1 jan 1997 ano
2.229
-0.156
-6.54%
1 jan 1998 ano
2.089
-0.141
-6.31%
1 jan 1999 ano
1.941
-0.147
-7.05%
1 jan 2000 ano
1.787
-0.154
-7.96%
1 jan 2001 ano
1.638
-0.149
-8.34%
1 jan 2002 ano
1.483
-0.154
-9.43%
1 jan 2003 ano
1.36
-0.123
-8.29%
1 jan 2004 ano
1.321
-0.039
-2.86%
1 jan 2005 ano
1.388
+0.067
5.07%
1 jan 2006 ano
1.527
+0.139
10.0%
1 jan 2007 ano
1.685
+0.157
10.3%
1 jan 2008 ano
1.817
+0.132
7.86%
1 jan 2009 ano
1.921
+0.104
5.7%
1 jan 2010 ano
1.98
+0.059
3.07%
1 jan 2011 ano
2.003
+0.024
1.2%
1 jan 2012 ano
2.024
+0.021
1.04%
1 jan 2013 ano
2.042
+0.018
0.89%
1 jan 2014 ano
2.028
-0.015
-0.71%
1 jan 2015 ano
1.976
-0.052
-2.57%
1 jan 2016 ano
1.898
-0.077
-3.9%
Classificação de países por estatísticas atuais por anos


Comentários: