29
/pt/
pt
AIzaSyAYiBZKx7MnpbEhh9jyipgxe19OcubqV5w
April 1, 2024
232619
Samoa
WSM
true
2
1
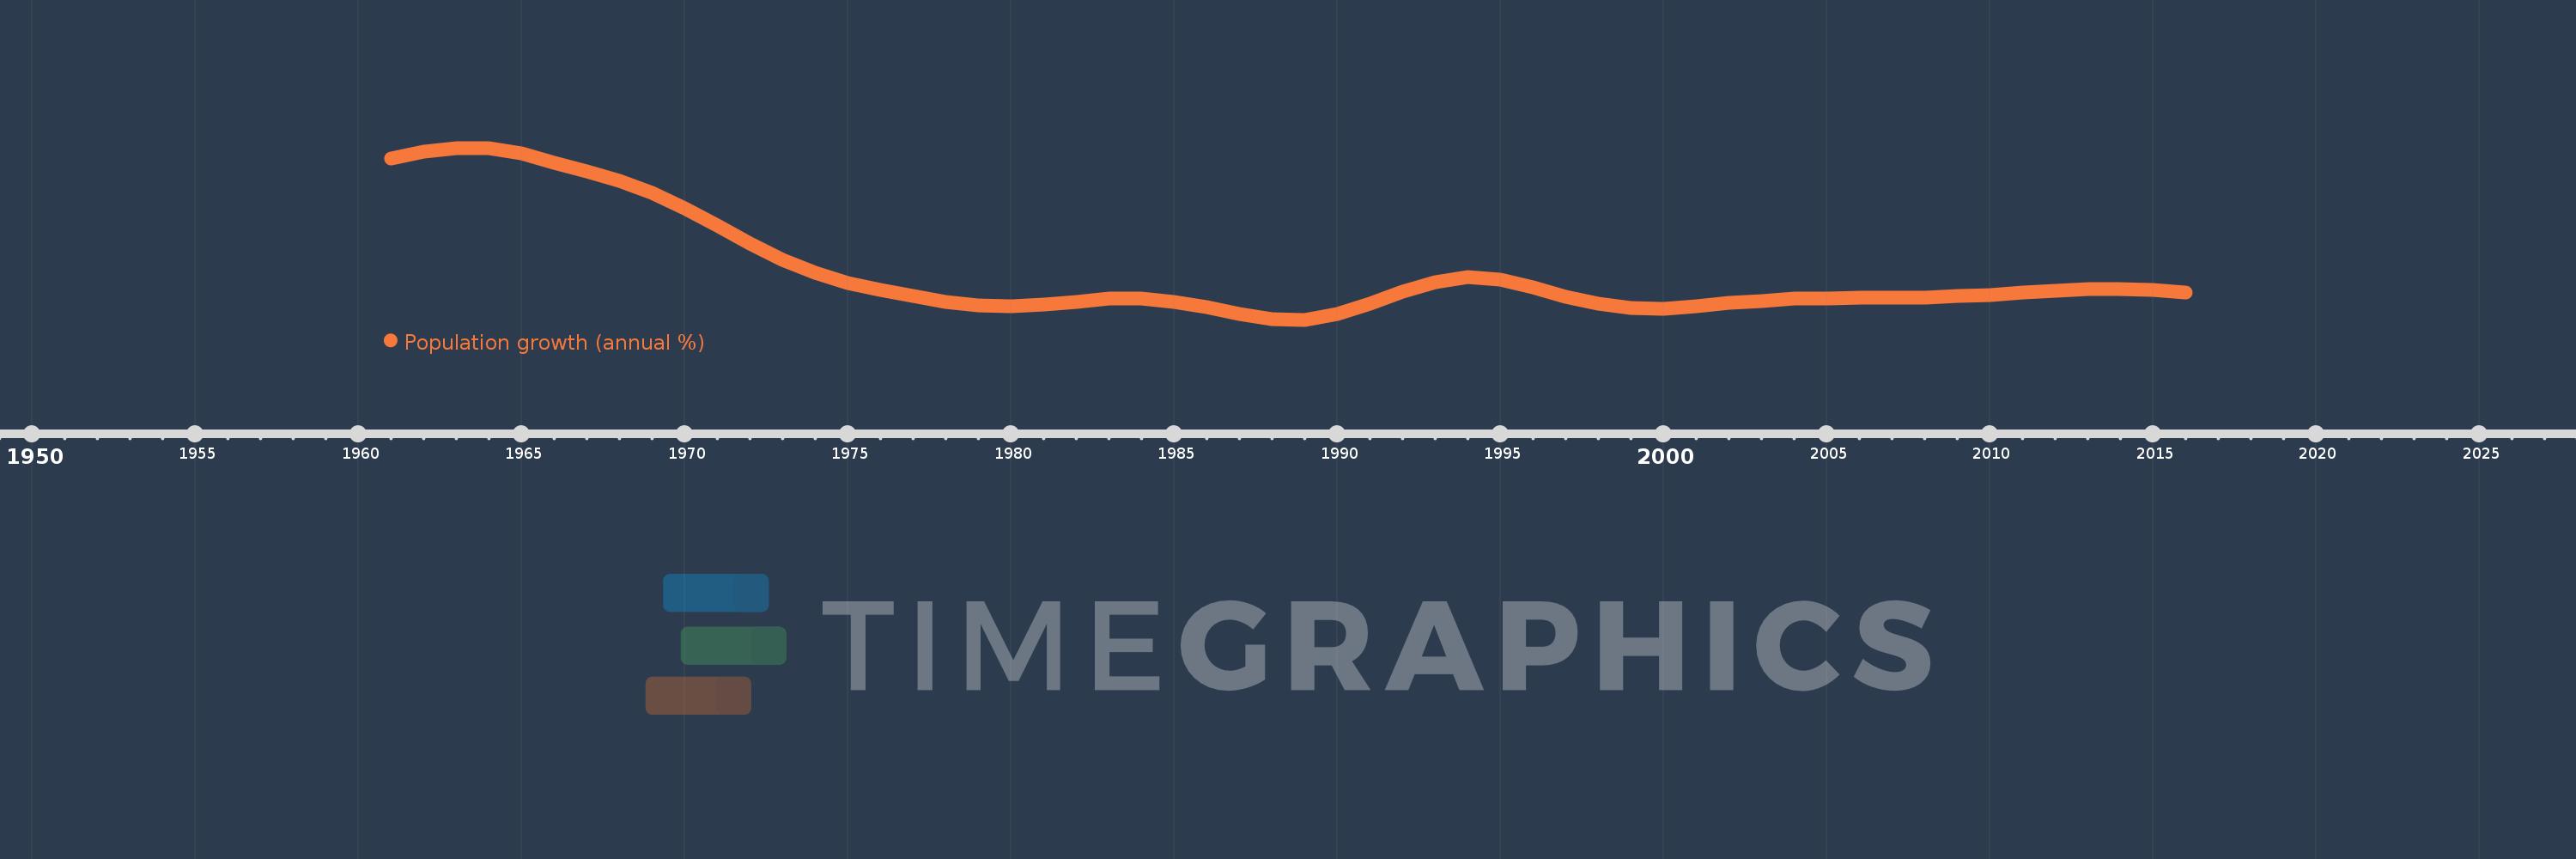
Population growth (annual %)
2016,2015,2014,2013,2012,2011,2010,2009,2008,2007,2006,2005,2004,2003,2002,2001,2000,1999,1998,1997,1996,1995,1994,1993,1992,1991,1990,1989,1988,1987,1986,1985,1984,1983,1982,1981,1980,1979,1978,1977,1976,1975,1974,1973,1972,1971,1970,1969,1968,1967,1966,1965,1964,1963,1962,1961
Estas estatísticas em outros países:
AfghanistanAlbaniaAlgeriaAmerican SamoaAndorraAngolaAntigua and BarbudaArab WorldArgentinaArmeniaArubaAustraliaAustriaAzerbaijanBahamas, TheBahrainBangladeshBarbadosBelarusBelgiumBelizeBeninBermudaBhutanBoliviaBosnia and HerzegovinaBotswanaBrazilBritish Virgin IslandsBrunei DarussalamBulgariaBurkina FasoBurundiCabo VerdeCambodiaCameroonCanadaCaribbean small statesCayman IslandsCentral African RepublicCentral Europe and the BalticsChadChannel IslandsChileChinaColombiaComorosCongo, Dem. Rep.Congo, Rep.Costa RicaCote d'IvoireCroatiaCubaCuracaoCyprusCzech RepublicDenmarkDjiboutiDominicaDominican RepublicEarly-demographic dividendEast Asia & PacificEast Asia & Pacific (excluding high income)East Asia & Pacific (IDA & IBRD countries)EcuadorEgypt, Arab Rep.El SalvadorEquatorial GuineaEritreaEstoniaEthiopiaEuro areaEurope & Central AsiaEurope & Central Asia (excluding high income)Europe & Central Asia (IDA & IBRD countries)European UnionFaroe IslandsFijiFinlandFragile and conflict affected situationsFranceFrench PolynesiaGabonGambia, TheGeorgiaGermanyGhanaGibraltarGreeceGreenlandGrenadaGuamGuatemalaGuineaGuinea-BissauGuyanaHaitiHeavily indebted poor countries (HIPC)High incomeHondurasHong Kong SAR, ChinaHungaryIBRD onlyIcelandIDA & IBRD totalIDA blendIDA onlyIDA totalIndiaIndonesiaIran, Islamic Rep.IraqIrelandIsle of ManIsraelItalyJamaicaJapanJordanKazakhstanKenyaKiribatiKorea, Dem. People’s Rep.Korea, Rep.KosovoKuwaitKyrgyz RepublicLao PDRLate-demographic dividendLatin America & Caribbean Latin America & Caribbean (excluding high income)Latin America & the Caribbean (IDA & IBRD countries)LatviaLeast developed countries: UN classificationLebanonLesothoLiberiaLibyaLiechtensteinLithuaniaLow & middle incomeLow incomeLower middle incomeLuxembourgMacao SAR, ChinaMacedonia, FYRMadagascarMalawiMalaysiaMaldivesMaliMaltaMarshall IslandsMauritaniaMauritiusMexicoMicronesia, Fed. Sts.Middle East & North AfricaMiddle East & North Africa (excluding high income)Middle East & North Africa (IDA & IBRD countries)Middle incomeMoldovaMonacoMongoliaMontenegroMoroccoMozambiqueMyanmarNamibiaNauruNepalNetherlandsNew CaledoniaNew ZealandNicaraguaNigerNigeriaNorth AmericaNorthern Mariana IslandsNorwayOECD membersOmanOther small statesPacific island small statesPakistanPalauPanamaPapua New GuineaParaguayPeruPhilippinesPolandPortugalPost-demographic dividendPre-demographic dividendPuerto RicoQatarRomaniaRussian FederationRwandaSamoaSan MarinoSao Tome and PrincipeSaudi ArabiaSenegalSerbiaSeychellesSierra LeoneSingaporeSint Maarten (Dutch part)Slovak RepublicSloveniaSmall statesSolomon IslandsSomaliaSouth AfricaSouth AsiaSouth Asia (IDA & IBRD)South SudanSpainSri LankaSt. Kitts and NevisSt. LuciaSt. Martin (French part)St. Vincent and the GrenadinesSub-Saharan Africa Sub-Saharan Africa (excluding high income)Sub-Saharan Africa (IDA & IBRD countries)SudanSurinameSwazilandSwedenSwitzerlandSyrian Arab RepublicTajikistanTanzaniaThailandTimor-LesteTogoTongaTrinidad and TobagoTunisiaTurkeyTurkmenistanTurks and Caicos IslandsTuvaluUgandaUkraineUnited Arab EmiratesUnited KingdomUnited StatesUpper middle incomeUruguayUzbekistanVanuatuVenezuela, RBVietnamVirgin Islands (U.S.)West Bank and GazaWorldYemen, Rep.ZambiaZimbabwe Linha do tempo:
Nesta escala de tempo está apresentado um gráfico de 1961 ano até 2016 ano Samoa. Dados de 1960 ano ausente. O número de observações reais por data: 56.
Fonte (nome):
Indicadores de desenvolvimento mundial
Fonte (organização):
Derived from total population. Population source: (1) United Nations Population Division. World Population Prospects, (2) United Nations Statistical Division. Population and Vital Statistics Report (various years), (3) Census reports and other statistical
Categorias:
Climate Change, Health
Foi atualizado:
23 abr 2017 ano
Indicadores de alterações dos valores ao longo dos anos
Mínimo:
0.254
1 jan 1989 ano
Máximo:
3.217
1 jan 1963 ano
Na data de observação
Valor
Mudança absoluta
A alteração em relação ao valor anterior
1 jan 1961 ano
3.041
+3.041
0.0%
1 jan 1962 ano
3.149
+0.108
3.57%
1 jan 1963 ano
3.217
+0.067
2.13%
1 jan 1964 ano
3.211
-0.006
-0.18%
1 jan 1965 ano
3.121
-0.09
-2.81%
1 jan 1966 ano
2.966
-0.154
-4.94%
1 jan 1967 ano
2.808
-0.158
-5.33%
1 jan 1968 ano
2.648
-0.16
-5.7%
1 jan 1969 ano
2.436
-0.212
-8.01%
1 jan 1970 ano
2.17
-0.266
-10.9%
1 jan 1971 ano
1.872
-0.299
-13.76%
1 jan 1972 ano
1.568
-0.304
-16.25%
1 jan 1973 ano
1.288
-0.279
-17.8%
1 jan 1974 ano
1.057
-0.231
-17.94%
1 jan 1975 ano
0.889
-0.168
-15.89%
1 jan 1976 ano
0.772
-0.117
-13.21%
1 jan 1977 ano
0.663
-0.109
-14.11%
1 jan 1978 ano
0.559
-0.104
-15.71%
1 jan 1979 ano
0.499
-0.06
-10.78%
1 jan 1980 ano
0.488
-0.011
-2.18%
1 jan 1981 ano
0.51
+0.022
4.52%
1 jan 1982 ano
0.565
+0.055
10.78%
1 jan 1983 ano
0.616
+0.051
9.0%
1 jan 1984 ano
0.622
+0.006
1.03%
1 jan 1985 ano
0.565
-0.057
-9.1%
1 jan 1986 ano
0.469
-0.096
-17.02%
1 jan 1987 ano
0.35
-0.119
-25.41%
1 jan 1988 ano
0.263
-0.087
-24.83%
1 jan 1989 ano
0.254
-0.009
-3.32%
1 jan 1990 ano
0.357
+0.102
40.3%
1 jan 1991 ano
0.532
+0.175
49.08%
1 jan 1992 ano
0.739
+0.207
38.93%
1 jan 1993 ano
0.907
+0.168
22.74%
1 jan 1994 ano
0.984
+0.077
8.53%
1 jan 1995 ano
0.941
-0.044
-4.46%
1 jan 1996 ano
0.81
-0.131
-13.92%
1 jan 1997 ano
0.655
-0.155
-19.11%
1 jan 1998 ano
0.533
-0.122
-18.64%
1 jan 1999 ano
0.457
-0.076
-14.3%
1 jan 2000 ano
0.449
-0.007
-1.59%
1 jan 2001 ano
0.491
+0.042
9.37%
1 jan 2002 ano
0.544
+0.053
10.76%
1 jan 2003 ano
0.582
+0.038
6.95%
1 jan 2004 ano
0.613
+0.03
5.22%
1 jan 2005 ano
0.627
+0.014
2.31%
1 jan 2006 ano
0.632
+0.006
0.88%
1 jan 2007 ano
0.634
+0.002
0.25%
1 jan 2008 ano
0.642
+0.008
1.28%
1 jan 2009 ano
0.657
+0.016
2.42%
1 jan 2010 ano
0.685
+0.027
4.12%
1 jan 2011 ano
0.717
+0.032
4.74%
1 jan 2012 ano
0.752
+0.035
4.94%
1 jan 2013 ano
0.78
+0.027
3.62%
1 jan 2014 ano
0.785
+0.006
0.71%
1 jan 2015 ano
0.761
-0.024
-3.04%
1 jan 2016 ano
0.718
-0.043
-5.65%
Classificação de países por estatísticas atuais por anos


Comentários: