29
/pt/
pt
AIzaSyAYiBZKx7MnpbEhh9jyipgxe19OcubqV5w
April 1, 2024
230242
Russian Federation
RUS
true
2
1
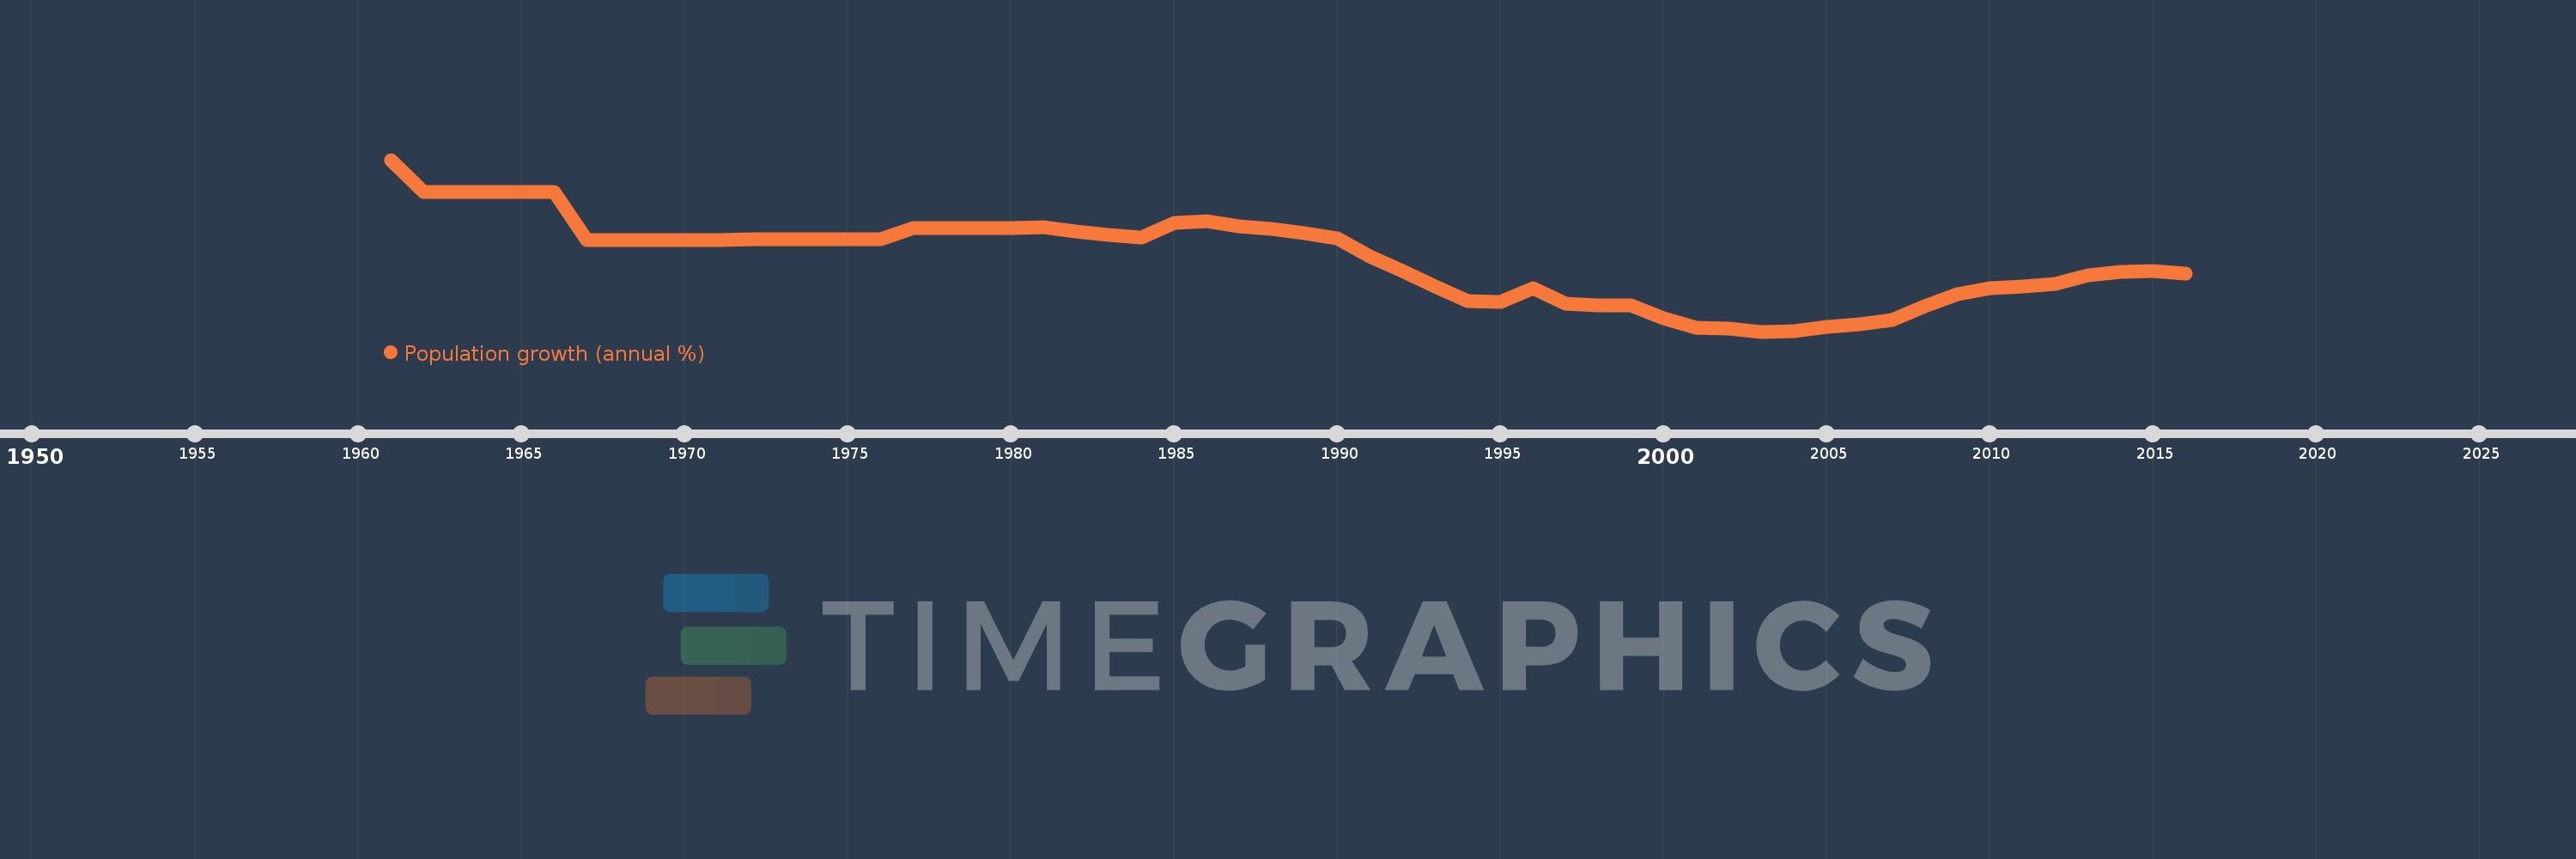
Population growth (annual %)
2016,2015,2014,2013,2012,2011,2010,2009,2008,2007,2006,2005,2004,2003,2002,2001,2000,1999,1998,1997,1996,1995,1994,1993,1992,1991,1990,1989,1988,1987,1986,1985,1984,1983,1982,1981,1980,1979,1978,1977,1976,1975,1974,1973,1972,1971,1970,1969,1968,1967,1966,1965,1964,1963,1962,1961
Estas estatísticas em outros países:
AfghanistanAlbaniaAlgeriaAmerican SamoaAndorraAngolaAntigua and BarbudaArab WorldArgentinaArmeniaArubaAustraliaAustriaAzerbaijanBahamas, TheBahrainBangladeshBarbadosBelarusBelgiumBelizeBeninBermudaBhutanBoliviaBosnia and HerzegovinaBotswanaBrazilBritish Virgin IslandsBrunei DarussalamBulgariaBurkina FasoBurundiCabo VerdeCambodiaCameroonCanadaCaribbean small statesCayman IslandsCentral African RepublicCentral Europe and the BalticsChadChannel IslandsChileChinaColombiaComorosCongo, Dem. Rep.Congo, Rep.Costa RicaCote d'IvoireCroatiaCubaCuracaoCyprusCzech RepublicDenmarkDjiboutiDominicaDominican RepublicEarly-demographic dividendEast Asia & PacificEast Asia & Pacific (excluding high income)East Asia & Pacific (IDA & IBRD countries)EcuadorEgypt, Arab Rep.El SalvadorEquatorial GuineaEritreaEstoniaEthiopiaEuro areaEurope & Central AsiaEurope & Central Asia (excluding high income)Europe & Central Asia (IDA & IBRD countries)European UnionFaroe IslandsFijiFinlandFragile and conflict affected situationsFranceFrench PolynesiaGabonGambia, TheGeorgiaGermanyGhanaGibraltarGreeceGreenlandGrenadaGuamGuatemalaGuineaGuinea-BissauGuyanaHaitiHeavily indebted poor countries (HIPC)High incomeHondurasHong Kong SAR, ChinaHungaryIBRD onlyIcelandIDA & IBRD totalIDA blendIDA onlyIDA totalIndiaIndonesiaIran, Islamic Rep.IraqIrelandIsle of ManIsraelItalyJamaicaJapanJordanKazakhstanKenyaKiribatiKorea, Dem. People’s Rep.Korea, Rep.KosovoKuwaitKyrgyz RepublicLao PDRLate-demographic dividendLatin America & Caribbean Latin America & Caribbean (excluding high income)Latin America & the Caribbean (IDA & IBRD countries)LatviaLeast developed countries: UN classificationLebanonLesothoLiberiaLibyaLiechtensteinLithuaniaLow & middle incomeLow incomeLower middle incomeLuxembourgMacao SAR, ChinaMacedonia, FYRMadagascarMalawiMalaysiaMaldivesMaliMaltaMarshall IslandsMauritaniaMauritiusMexicoMicronesia, Fed. Sts.Middle East & North AfricaMiddle East & North Africa (excluding high income)Middle East & North Africa (IDA & IBRD countries)Middle incomeMoldovaMonacoMongoliaMontenegroMoroccoMozambiqueMyanmarNamibiaNauruNepalNetherlandsNew CaledoniaNew ZealandNicaraguaNigerNigeriaNorth AmericaNorthern Mariana IslandsNorwayOECD membersOmanOther small statesPacific island small statesPakistanPalauPanamaPapua New GuineaParaguayPeruPhilippinesPolandPortugalPost-demographic dividendPre-demographic dividendPuerto RicoQatarRomaniaRussian FederationRwandaSamoaSan MarinoSao Tome and PrincipeSaudi ArabiaSenegalSerbiaSeychellesSierra LeoneSingaporeSint Maarten (Dutch part)Slovak RepublicSloveniaSmall statesSolomon IslandsSomaliaSouth AfricaSouth AsiaSouth Asia (IDA & IBRD)South SudanSpainSri LankaSt. Kitts and NevisSt. LuciaSt. Martin (French part)St. Vincent and the GrenadinesSub-Saharan Africa Sub-Saharan Africa (excluding high income)Sub-Saharan Africa (IDA & IBRD countries)SudanSurinameSwazilandSwedenSwitzerlandSyrian Arab RepublicTajikistanTanzaniaThailandTimor-LesteTogoTongaTrinidad and TobagoTunisiaTurkeyTurkmenistanTurks and Caicos IslandsTuvaluUgandaUkraineUnited Arab EmiratesUnited KingdomUnited StatesUpper middle incomeUruguayUzbekistanVanuatuVenezuela, RBVietnamVirgin Islands (U.S.)West Bank and GazaWorldYemen, Rep.ZambiaZimbabwe Linha do tempo:
Nesta escala de tempo está apresentado um gráfico de 1961 ano até 2016 ano Russian Federation. Dados de 1960 ano ausente. O número de observações reais por data: 56.
Fonte (nome):
Indicadores de desenvolvimento mundial
Fonte (organização):
Derived from total population. Population source: (1) United Nations Population Division. World Population Prospects, (2) United Nations Statistical Division. Population and Vital Statistics Report (various years), (3) Census reports and other statistical
Categorias:
Climate Change, Health
Foi atualizado:
23 abr 2017 ano
Indicadores de alterações dos valores ao longo dos anos
Mínimo:
-0.46
1 jan 2003 ano
Máximo:
1.469
1 jan 1961 ano
Na data de observação
Valor
Mudança absoluta
A alteração em relação ao valor anterior
1 jan 1961 ano
1.469
+1.469
0.0%
1 jan 1962 ano
1.111
-0.359
-24.42%
1 jan 1963 ano
1.111
+0.001
0.08%
1 jan 1964 ano
1.111
-0.001
-0.08%
1 jan 1965 ano
1.111
+0.001
0.05%
1 jan 1966 ano
1.111
0.0
-0.03%
1 jan 1967 ano
0.569
-0.542
-48.79%
1 jan 1968 ano
0.569
+0.001
0.12%
1 jan 1969 ano
0.569
0.0
-0.02%
1 jan 1970 ano
0.569
0.0
-0.02%
1 jan 1971 ano
0.569
0.0
-0.03%
1 jan 1972 ano
0.574
+0.005
0.91%
1 jan 1973 ano
0.573
-0.001
-0.17%
1 jan 1974 ano
0.575
+0.001
0.22%
1 jan 1975 ano
0.573
-0.001
-0.18%
1 jan 1976 ano
0.574
+0.0
0.08%
1 jan 1977 ano
0.703
+0.129
22.52%
1 jan 1978 ano
0.703
-0.001
-0.07%
1 jan 1979 ano
0.703
+0.0
0.03%
1 jan 1980 ano
0.703
+0.0
0.02%
1 jan 1981 ano
0.71
+0.007
0.94%
1 jan 1982 ano
0.668
-0.042
-5.94%
1 jan 1983 ano
0.628
-0.039
-5.87%
1 jan 1984 ano
0.598
-0.03
-4.78%
1 jan 1985 ano
0.757
+0.159
26.59%
1 jan 1986 ano
0.777
+0.019
2.55%
1 jan 1987 ano
0.718
-0.059
-7.61%
1 jan 1988 ano
0.697
-0.02
-2.81%
1 jan 1989 ano
0.648
-0.049
-7.04%
1 jan 1990 ano
0.587
-0.062
-9.52%
1 jan 1991 ano
0.386
-0.201
-34.23%
1 jan 1992 ano
0.224
-0.162
-42.03%
1 jan 1993 ano
0.044
-0.18
-80.45%
1 jan 1994 ano
-0.114
-0.157
-360.09%
1 jan 1995 ano
-0.124
-0.01
9.01%
1 jan 1996 ano
0.027
+0.151
-121.6%
1 jan 1997 ano
-0.145
-0.172
-643.25%
1 jan 1998 ano
-0.165
-0.02
13.65%
1 jan 1999 ano
-0.166
0.0
0.12%
1 jan 2000 ano
-0.309
-0.144
86.98%
1 jan 2001 ano
-0.421
-0.111
35.9%
1 jan 2002 ano
-0.424
-0.004
0.85%
1 jan 2003 ano
-0.46
-0.036
8.47%
1 jan 2004 ano
-0.454
+0.006
-1.38%
1 jan 2005 ano
-0.403
+0.051
-11.26%
1 jan 2006 ano
-0.381
+0.021
-5.25%
1 jan 2007 ano
-0.327
+0.054
-14.2%
1 jan 2008 ano
-0.171
+0.156
-47.75%
1 jan 2009 ano
-0.044
+0.127
-74.31%
1 jan 2010 ano
0.03
+0.074
-168.53%
1 jan 2011 ano
0.045
+0.015
49.06%
1 jan 2012 ano
0.078
+0.033
73.69%
1 jan 2013 ano
0.168
+0.09
115.86%
1 jan 2014 ano
0.213
+0.045
26.51%
1 jan 2015 ano
0.218
+0.005
2.21%
1 jan 2016 ano
0.193
-0.025
-11.51%
Classificação de países por estatísticas atuais por anos


Comentários: