29
/fr/
fr
AIzaSyAYiBZKx7MnpbEhh9jyipgxe19OcubqV5w
April 1, 2024
251562
St. Martin (French part)
MAF
true
2
1
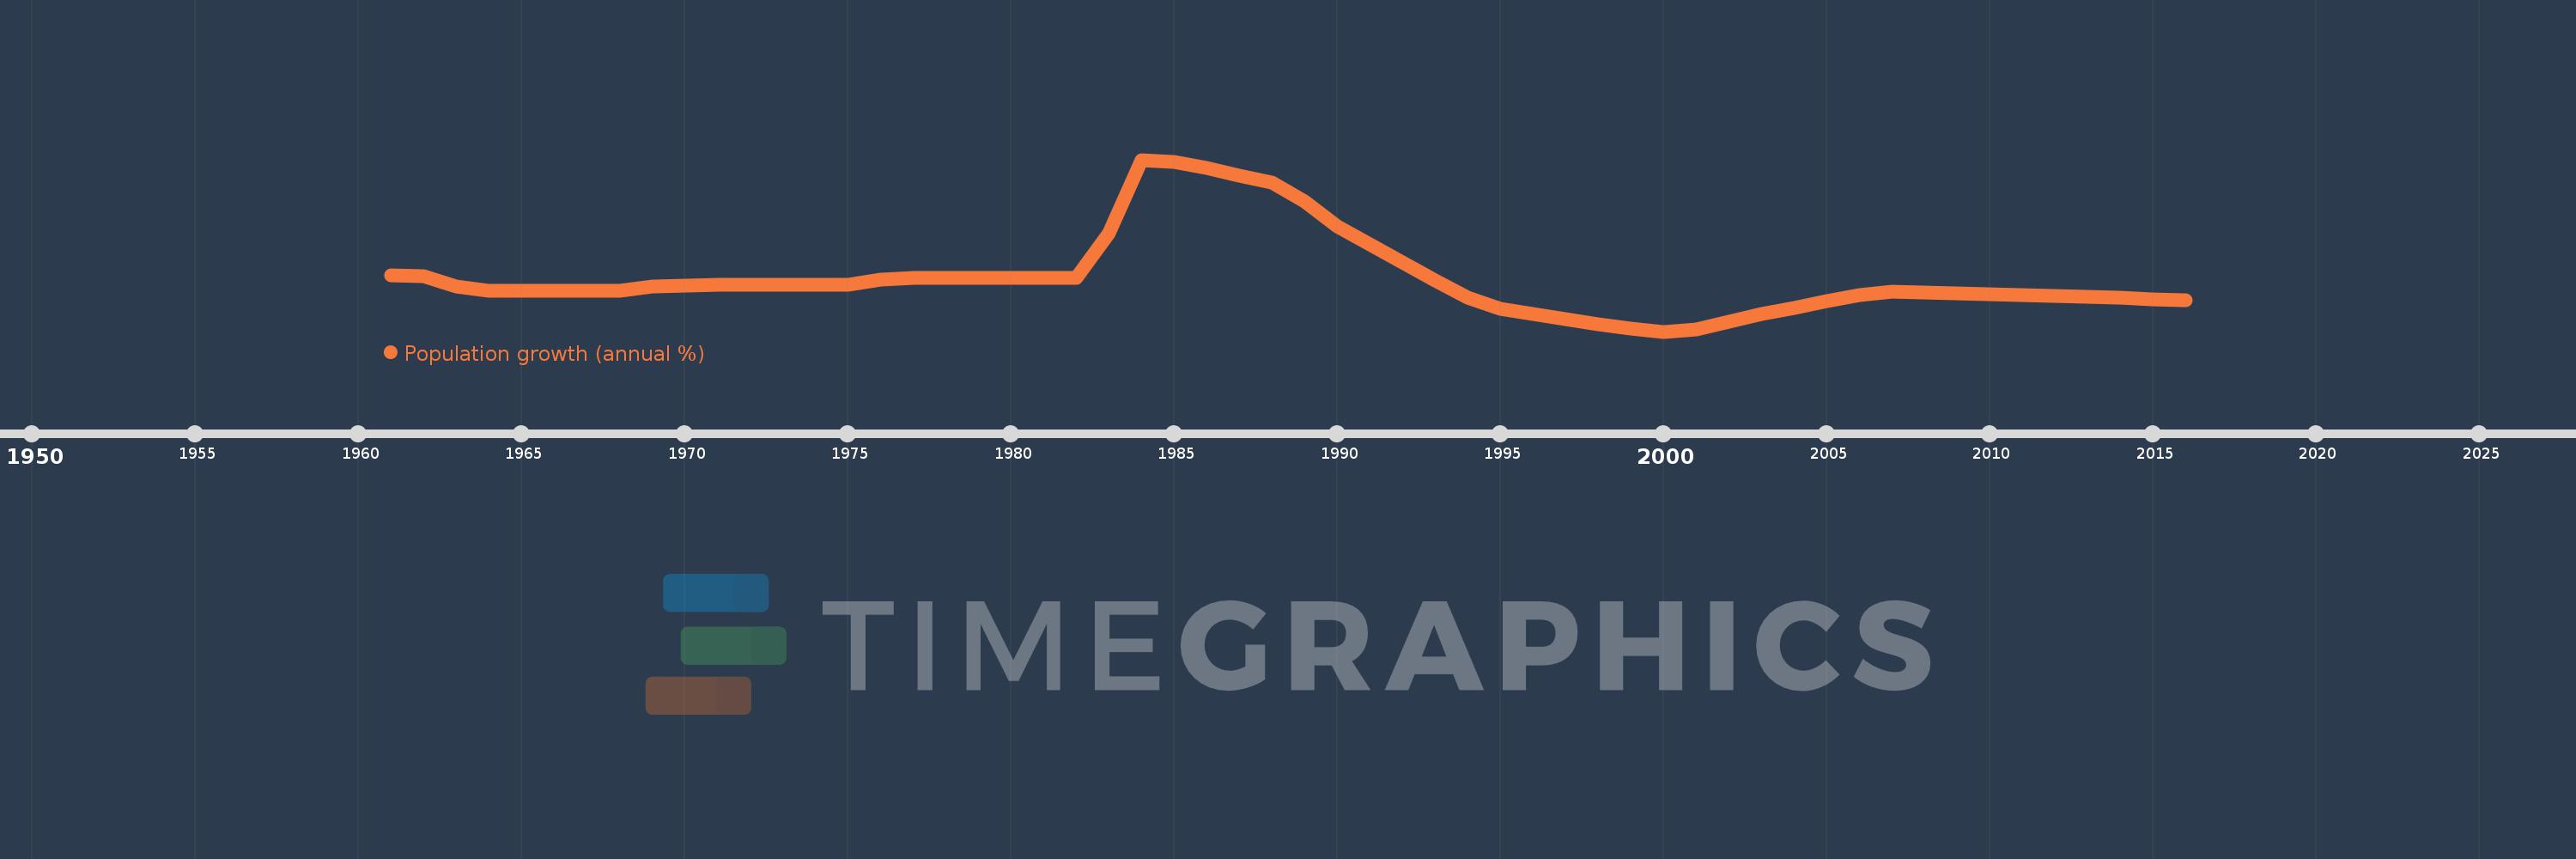
Population growth (annual %)
2016,2015,2014,2013,2012,2011,2010,2009,2008,2007,2006,2005,2004,2003,2002,2001,2000,1999,1998,1997,1996,1995,1994,1993,1992,1991,1990,1989,1988,1987,1986,1985,1984,1983,1982,1981,1980,1979,1978,1977,1976,1975,1974,1973,1972,1971,1970,1969,1968,1967,1966,1965,1964,1963,1962,1961
Cette statistique dans les autres pays:
AfghanistanAlbaniaAlgeriaAmerican SamoaAndorraAngolaAntigua and BarbudaArab WorldArgentinaArmeniaArubaAustraliaAustriaAzerbaijanBahamas, TheBahrainBangladeshBarbadosBelarusBelgiumBelizeBeninBermudaBhutanBoliviaBosnia and HerzegovinaBotswanaBrazilBritish Virgin IslandsBrunei DarussalamBulgariaBurkina FasoBurundiCabo VerdeCambodiaCameroonCanadaCaribbean small statesCayman IslandsCentral African RepublicCentral Europe and the BalticsChadChannel IslandsChileChinaColombiaComorosCongo, Dem. Rep.Congo, Rep.Costa RicaCote d'IvoireCroatiaCubaCuracaoCyprusCzech RepublicDenmarkDjiboutiDominicaDominican RepublicEarly-demographic dividendEast Asia & PacificEast Asia & Pacific (excluding high income)East Asia & Pacific (IDA & IBRD countries)EcuadorEgypt, Arab Rep.El SalvadorEquatorial GuineaEritreaEstoniaEthiopiaEuro areaEurope & Central AsiaEurope & Central Asia (excluding high income)Europe & Central Asia (IDA & IBRD countries)European UnionFaroe IslandsFijiFinlandFragile and conflict affected situationsFranceFrench PolynesiaGabonGambia, TheGeorgiaGermanyGhanaGibraltarGreeceGreenlandGrenadaGuamGuatemalaGuineaGuinea-BissauGuyanaHaitiHeavily indebted poor countries (HIPC)High incomeHondurasHong Kong SAR, ChinaHungaryIBRD onlyIcelandIDA & IBRD totalIDA blendIDA onlyIDA totalIndiaIndonesiaIran, Islamic Rep.IraqIrelandIsle of ManIsraelItalyJamaicaJapanJordanKazakhstanKenyaKiribatiKorea, Dem. People’s Rep.Korea, Rep.KosovoKuwaitKyrgyz RepublicLao PDRLate-demographic dividendLatin America & Caribbean Latin America & Caribbean (excluding high income)Latin America & the Caribbean (IDA & IBRD countries)LatviaLeast developed countries: UN classificationLebanonLesothoLiberiaLibyaLiechtensteinLithuaniaLow & middle incomeLow incomeLower middle incomeLuxembourgMacao SAR, ChinaMacedonia, FYRMadagascarMalawiMalaysiaMaldivesMaliMaltaMarshall IslandsMauritaniaMauritiusMexicoMicronesia, Fed. Sts.Middle East & North AfricaMiddle East & North Africa (excluding high income)Middle East & North Africa (IDA & IBRD countries)Middle incomeMoldovaMonacoMongoliaMontenegroMoroccoMozambiqueMyanmarNamibiaNauruNepalNetherlandsNew CaledoniaNew ZealandNicaraguaNigerNigeriaNorth AmericaNorthern Mariana IslandsNorwayOECD membersOmanOther small statesPacific island small statesPakistanPalauPanamaPapua New GuineaParaguayPeruPhilippinesPolandPortugalPost-demographic dividendPre-demographic dividendPuerto RicoQatarRomaniaRussian FederationRwandaSamoaSan MarinoSao Tome and PrincipeSaudi ArabiaSenegalSerbiaSeychellesSierra LeoneSingaporeSint Maarten (Dutch part)Slovak RepublicSloveniaSmall statesSolomon IslandsSomaliaSouth AfricaSouth AsiaSouth Asia (IDA & IBRD)South SudanSpainSri LankaSt. Kitts and NevisSt. LuciaSt. Martin (French part)St. Vincent and the GrenadinesSub-Saharan Africa Sub-Saharan Africa (excluding high income)Sub-Saharan Africa (IDA & IBRD countries)SudanSurinameSwazilandSwedenSwitzerlandSyrian Arab RepublicTajikistanTanzaniaThailandTimor-LesteTogoTongaTrinidad and TobagoTunisiaTurkeyTurkmenistanTurks and Caicos IslandsTuvaluUgandaUkraineUnited Arab EmiratesUnited KingdomUnited StatesUpper middle incomeUruguayUzbekistanVanuatuVenezuela, RBVietnamVirgin Islands (U.S.)West Bank and GazaWorldYemen, Rep.ZambiaZimbabwe La ligne de temps
Cette échelle de temps montre un graphique de 1961 année à 2016 année St. Martin (French part). Les données jusqu'à 1960 année ne sont pas présentés. Quantité d'observations actuelles selon dates: 56.
Source (désignation):
Les indicateurs du développement mondiale
Source (organisation):
Derived from total population. Population source: (1) United Nations Population Division. World Population Prospects, (2) United Nations Statistical Division. Population and Vital Statistics Report (various years), (3) Census reports and other statistical
Catégories:
Climate Change, Health
Dernière mise à jour
23 avr. 2017
Les indicateurs de changement de valeurs selon les années
Minimum:
-3.53
1 janv. 2000
Maximum:
19.597
1 janv. 1984
Pour la date d''observation
Valeur
Changement absolu
Le changement par rapport à la valeur précédente
1 janv. 1961
4.005
+4.005
0.0%
1 janv. 1962
3.986
-0.019
-0.49%
1 janv. 1963
2.506
-1.48
-37.13%
1 janv. 1964
1.952
-0.554
-22.11%
1 janv. 1965
1.957
+0.005
0.24%
1 janv. 1966
1.94
-0.017
-0.86%
1 janv. 1967
1.943
+0.004
0.19%
1 janv. 1968
1.946
+0.003
0.14%
1 janv. 1969
2.511
+0.565
29.05%
1 janv. 1970
2.714
+0.203
8.08%
1 janv. 1971
2.734
+0.02
0.74%
1 janv. 1972
2.733
-0.001
-0.05%
1 janv. 1973
2.73
-0.003
-0.12%
1 janv. 1974
2.725
-0.005
-0.18%
1 janv. 1975
2.718
-0.006
-0.24%
1 janv. 1976
3.444
+0.726
26.71%
1 janv. 1977
3.729
+0.284
8.25%
1 janv. 1978
3.728
-0.001
-0.03%
1 janv. 1979
3.722
-0.006
-0.16%
1 janv. 1980
3.739
+0.017
0.46%
1 janv. 1981
3.723
-0.016
-0.43%
1 janv. 1982
3.729
+0.006
0.17%
1 janv. 1983
9.706
+5.977
160.29%
1 janv. 1984
19.597
+9.891
101.9%
1 janv. 1985
19.282
-0.315
-1.61%
1 janv. 1986
18.518
-0.764
-3.96%
1 janv. 1987
17.507
-1.011
-5.46%
1 janv. 1988
16.507
-1.001
-5.71%
1 janv. 1989
13.979
-2.527
-15.31%
1 janv. 1990
10.678
-3.301
-23.61%
1 janv. 1991
8.183
-2.495
-23.37%
1 janv. 1992
5.773
-2.41
-29.45%
1 janv. 1993
3.31
-2.463
-42.66%
1 janv. 1994
1.046
-2.264
-68.39%
1 janv. 1995
-0.422
-1.469
-140.34%
1 janv. 1996
-1.173
-0.751
177.92%
1 janv. 1997
-1.882
-0.709
60.46%
1 janv. 1998
-2.517
-0.635
33.73%
1 janv. 1999
-3.069
-0.551
21.9%
1 janv. 2000
-3.53
-0.462
15.04%
1 janv. 2001
-3.193
+0.337
-9.54%
1 janv. 2002
-2.144
+1.05
-32.87%
1 janv. 2003
-1.202
+0.942
-43.92%
1 janv. 2004
-0.317
+0.885
-73.6%
1 janv. 2005
0.55
+0.868
-273.36%
1 janv. 2006
1.415
+0.864
157.06%
1 janv. 2007
1.804
+0.389
27.52%
1 janv. 2008
1.713
-0.091
-5.03%
1 janv. 2009
1.616
-0.097
-5.66%
1 janv. 2010
1.5
-0.116
-7.19%
1 janv. 2011
1.382
-0.118
-7.87%
1 janv. 2012
1.249
-0.133
-9.63%
1 janv. 2013
1.117
-0.132
-10.54%
1 janv. 2014
0.98
-0.137
-12.26%
1 janv. 2015
0.847
-0.133
-13.58%
1 janv. 2016
0.708
-0.139
-16.44%
Classement des pays selon les statistiques actuelles par années


Commentaires: