29
/it/
it
AIzaSyAYiBZKx7MnpbEhh9jyipgxe19OcubqV5w
April 1, 2024
280215
Vanuatu
VUT
true
2
1
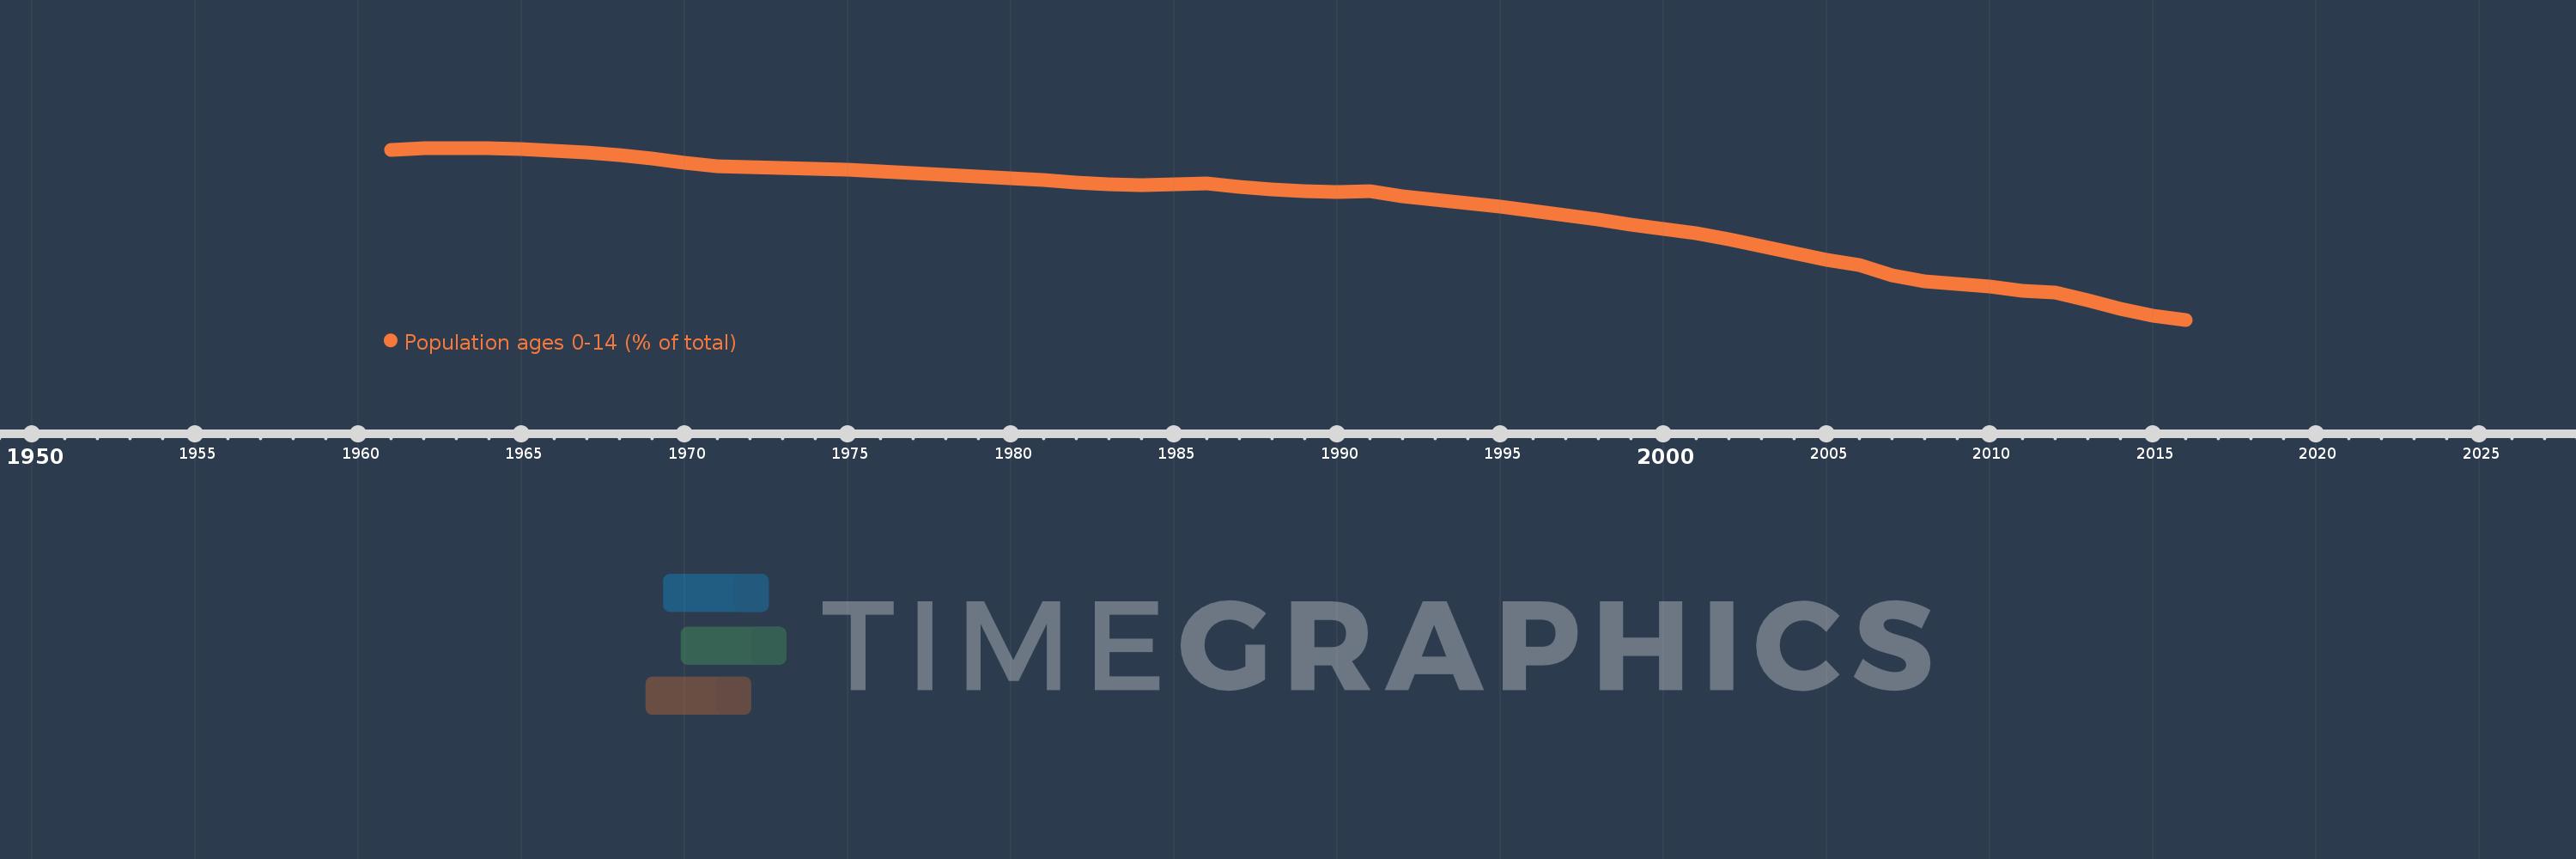
Population ages 0-14 (% of total)
2016,2015,2014,2013,2012,2011,2010,2009,2008,2007,2006,2005,2004,2003,2002,2001,2000,1999,1998,1997,1996,1995,1994,1993,1992,1991,1990,1989,1988,1987,1986,1985,1984,1983,1982,1981,1980,1979,1978,1977,1976,1975,1974,1973,1972,1971,1970,1969,1968,1967,1966,1965,1964,1963,1962,1961
Queste statistiche in altri paesi:
AfghanistanAlbaniaAlgeriaAngolaAntigua and BarbudaArab WorldArgentinaArmeniaArubaAustraliaAustriaAzerbaijanBahamas, TheBahrainBangladeshBarbadosBelarusBelgiumBelizeBeninBhutanBoliviaBosnia and HerzegovinaBotswanaBrazilBrunei DarussalamBulgariaBurkina FasoBurundiCabo VerdeCambodiaCameroonCanadaCaribbean small statesCentral African RepublicCentral Europe and the BalticsChadChannel IslandsChileChinaColombiaComorosCongo, Dem. Rep.Congo, Rep.Costa RicaCote d'IvoireCroatiaCubaCuracaoCyprusCzech RepublicDenmarkDjiboutiDominican RepublicEarly-demographic dividendEast Asia & PacificEast Asia & Pacific (excluding high income)East Asia & Pacific (IDA & IBRD countries)EcuadorEgypt, Arab Rep.El SalvadorEquatorial GuineaEritreaEstoniaEthiopiaEuro areaEurope & Central AsiaEurope & Central Asia (excluding high income)Europe & Central Asia (IDA & IBRD countries)European UnionFijiFinlandFragile and conflict affected situationsFranceFrench PolynesiaGabonGambia, TheGeorgiaGermanyGhanaGreeceGrenadaGuamGuatemalaGuineaGuinea-BissauGuyanaHaitiHeavily indebted poor countries (HIPC)High incomeHondurasHong Kong SAR, ChinaHungaryIBRD onlyIcelandIDA & IBRD totalIDA blendIDA onlyIDA totalIndiaIndonesiaIran, Islamic Rep.IraqIrelandIsraelItalyJamaicaJapanJordanKazakhstanKenyaKiribatiKorea, Dem. People’s Rep.Korea, Rep.KosovoKuwaitKyrgyz RepublicLao PDRLate-demographic dividendLatin America & Caribbean Latin America & Caribbean (excluding high income)Latin America & the Caribbean (IDA & IBRD countries)LatviaLeast developed countries: UN classificationLebanonLesothoLiberiaLibyaLithuaniaLow & middle incomeLow incomeLower middle incomeLuxembourgMacao SAR, ChinaMacedonia, FYRMadagascarMalawiMalaysiaMaldivesMaliMaltaMauritaniaMauritiusMexicoMicronesia, Fed. Sts.Middle East & North AfricaMiddle East & North Africa (excluding high income)Middle East & North Africa (IDA & IBRD countries)Middle incomeMoldovaMongoliaMontenegroMoroccoMozambiqueMyanmarNamibiaNepalNetherlandsNew CaledoniaNew ZealandNicaraguaNigerNigeriaNorth AmericaNorwayOECD membersOmanOther small statesPacific island small statesPakistanPanamaPapua New GuineaParaguayPeruPhilippinesPolandPortugalPost-demographic dividendPre-demographic dividendPuerto RicoQatarRomaniaRussian FederationRwandaSamoaSao Tome and PrincipeSaudi ArabiaSenegalSerbiaSeychellesSierra LeoneSingaporeSlovak RepublicSloveniaSmall statesSolomon IslandsSomaliaSouth AfricaSouth AsiaSouth Asia (IDA & IBRD)South SudanSpainSri LankaSt. LuciaSt. Vincent and the GrenadinesSub-Saharan Africa Sub-Saharan Africa (excluding high income)Sub-Saharan Africa (IDA & IBRD countries)SudanSurinameSwazilandSwedenSwitzerlandSyrian Arab RepublicTajikistanTanzaniaThailandTimor-LesteTogoTongaTrinidad and TobagoTunisiaTurkeyTurkmenistanUgandaUkraineUnited Arab EmiratesUnited KingdomUnited StatesUpper middle incomeUruguayUzbekistanVanuatuVenezuela, RBVietnamVirgin Islands (U.S.)West Bank and GazaWorldYemen, Rep.ZambiaZimbabwe Linea del tempo:
Questa scala temporale mostra un grafico dal 1961 anno al 2016 anno. Vanuatu. I dati fino ad 1960 anno non disponibili. Il numero di osservazioni attuali secondo i date: 56.
La fonte (nome):
Indicatori dello sviluppo mondiale
La fonte (organizzazione):
World Bank staff estimates based on age distributions of United Nations Population Division's World Population Prospects.
Categorie:
Education, Health
sono stati aggiornati
23 apr 2017 anni
Indicatori delle variazioni dei valori per anni
Minima:
36.531
1 gen 2016 anni
Massimo:
46.317
1 gen 1963 anni
Alla data di osservazione
Valore
Variazione assoluta
La variazione rispetto al valore precedente
1 gen 1961 anni
46.188
+46.188
0.0%
1 gen 1962 anni
46.281
+0.093
0.2%
1 gen 1963 anni
46.317
+0.037
0.08%
1 gen 1964 anni
46.311
-0.007
-0.01%
1 gen 1965 anni
46.262
-0.049
-0.11%
1 gen 1966 anni
46.151
-0.111
-0.24%
1 gen 1967 anni
46.052
-0.099
-0.21%
1 gen 1968 anni
45.907
-0.145
-0.31%
1 gen 1969 anni
45.714
-0.193
-0.42%
1 gen 1970 anni
45.49
-0.224
-0.49%
1 gen 1971 anni
45.266
-0.224
-0.49%
1 gen 1972 anni
45.229
-0.037
-0.08%
1 gen 1973 anni
45.176
-0.053
-0.12%
1 gen 1974 anni
45.126
-0.05
-0.11%
1 gen 1975 anni
45.062
-0.064
-0.14%
1 gen 1976 anni
44.964
-0.098
-0.22%
1 gen 1977 anni
44.893
-0.071
-0.16%
1 gen 1978 anni
44.784
-0.109
-0.24%
1 gen 1979 anni
44.669
-0.115
-0.26%
1 gen 1980 anni
44.573
-0.096
-0.21%
1 gen 1981 anni
44.489
-0.084
-0.19%
1 gen 1982 anni
44.322
-0.167
-0.37%
1 gen 1983 anni
44.229
-0.093
-0.21%
1 gen 1984 anni
44.208
-0.022
-0.05%
1 gen 1985 anni
44.236
+0.028
0.06%
1 gen 1986 anni
44.285
+0.049
0.11%
1 gen 1987 anni
44.084
-0.201
-0.45%
1 gen 1988 anni
43.934
-0.15
-0.34%
1 gen 1989 anni
43.851
-0.083
-0.19%
1 gen 1990 anni
43.829
-0.023
-0.05%
1 gen 1991 anni
43.835
+0.007
0.02%
1 gen 1992 anni
43.573
-0.262
-0.6%
1 gen 1993 anni
43.357
-0.216
-0.49%
1 gen 1994 anni
43.166
-0.192
-0.44%
1 gen 1995 anni
42.965
-0.201
-0.47%
1 gen 1996 anni
42.722
-0.243
-0.56%
1 gen 1997 anni
42.503
-0.219
-0.51%
1 gen 1998 anni
42.24
-0.263
-0.62%
1 gen 1999 anni
41.964
-0.276
-0.65%
1 gen 2000 anni
41.708
-0.256
-0.61%
1 gen 2001 anni
41.481
-0.228
-0.55%
1 gen 2002 anni
41.121
-0.36
-0.87%
1 gen 2003 anni
40.72
-0.401
-0.98%
1 gen 2004 anni
40.317
-0.403
-0.99%
1 gen 2005 anni
39.958
-0.359
-0.89%
1 gen 2006 anni
39.658
-0.3
-0.75%
1 gen 2007 anni
39.052
-0.606
-1.53%
1 gen 2008 anni
38.703
-0.349
-0.89%
1 gen 2009 anni
38.547
-0.156
-0.4%
1 gen 2010 anni
38.419
-0.128
-0.33%
1 gen 2011 anni
38.2
-0.219
-0.57%
1 gen 2012 anni
38.059
-0.141
-0.37%
1 gen 2013 anni
37.661
-0.398
-1.05%
1 gen 2014 anni
37.172
-0.49
-1.3%
1 gen 2015 anni
36.778
-0.394
-1.06%
1 gen 2016 anni
36.531
-0.247
-0.67%
Classificazione dei paesi secondo i statistiche attuali per anni


Commenti: