29
/it/
it
AIzaSyAYiBZKx7MnpbEhh9jyipgxe19OcubqV5w
April 1, 2024
146122
Guinea
GIN
true
2
1
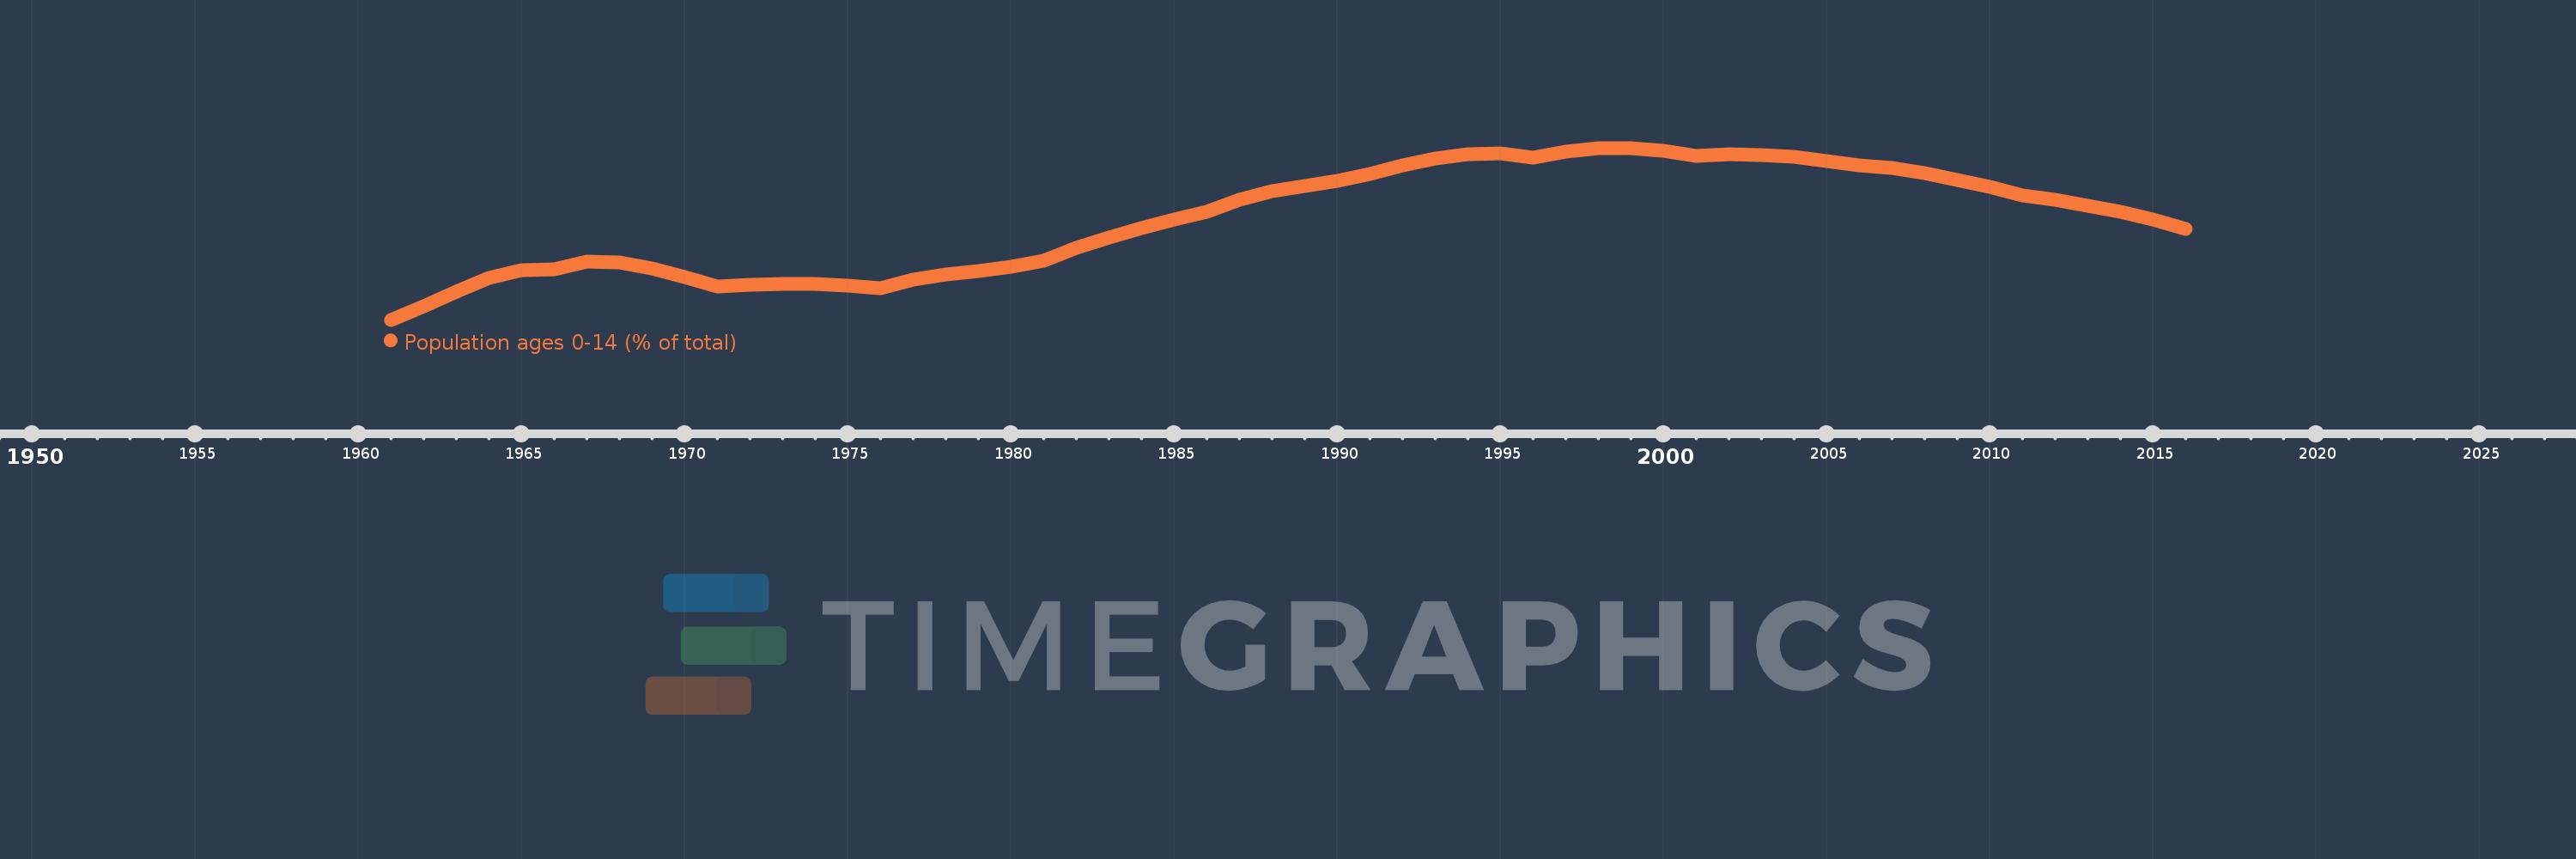
Population ages 0-14 (% of total)
2016,2015,2014,2013,2012,2011,2010,2009,2008,2007,2006,2005,2004,2003,2002,2001,2000,1999,1998,1997,1996,1995,1994,1993,1992,1991,1990,1989,1988,1987,1986,1985,1984,1983,1982,1981,1980,1979,1978,1977,1976,1975,1974,1973,1972,1971,1970,1969,1968,1967,1966,1965,1964,1963,1962,1961
Queste statistiche in altri paesi:
AfghanistanAlbaniaAlgeriaAngolaAntigua and BarbudaArab WorldArgentinaArmeniaArubaAustraliaAustriaAzerbaijanBahamas, TheBahrainBangladeshBarbadosBelarusBelgiumBelizeBeninBhutanBoliviaBosnia and HerzegovinaBotswanaBrazilBrunei DarussalamBulgariaBurkina FasoBurundiCabo VerdeCambodiaCameroonCanadaCaribbean small statesCentral African RepublicCentral Europe and the BalticsChadChannel IslandsChileChinaColombiaComorosCongo, Dem. Rep.Congo, Rep.Costa RicaCote d'IvoireCroatiaCubaCuracaoCyprusCzech RepublicDenmarkDjiboutiDominican RepublicEarly-demographic dividendEast Asia & PacificEast Asia & Pacific (excluding high income)East Asia & Pacific (IDA & IBRD countries)EcuadorEgypt, Arab Rep.El SalvadorEquatorial GuineaEritreaEstoniaEthiopiaEuro areaEurope & Central AsiaEurope & Central Asia (excluding high income)Europe & Central Asia (IDA & IBRD countries)European UnionFijiFinlandFragile and conflict affected situationsFranceFrench PolynesiaGabonGambia, TheGeorgiaGermanyGhanaGreeceGrenadaGuamGuatemalaGuineaGuinea-BissauGuyanaHaitiHeavily indebted poor countries (HIPC)High incomeHondurasHong Kong SAR, ChinaHungaryIBRD onlyIcelandIDA & IBRD totalIDA blendIDA onlyIDA totalIndiaIndonesiaIran, Islamic Rep.IraqIrelandIsraelItalyJamaicaJapanJordanKazakhstanKenyaKiribatiKorea, Dem. People’s Rep.Korea, Rep.KosovoKuwaitKyrgyz RepublicLao PDRLate-demographic dividendLatin America & Caribbean Latin America & Caribbean (excluding high income)Latin America & the Caribbean (IDA & IBRD countries)LatviaLeast developed countries: UN classificationLebanonLesothoLiberiaLibyaLithuaniaLow & middle incomeLow incomeLower middle incomeLuxembourgMacao SAR, ChinaMacedonia, FYRMadagascarMalawiMalaysiaMaldivesMaliMaltaMauritaniaMauritiusMexicoMicronesia, Fed. Sts.Middle East & North AfricaMiddle East & North Africa (excluding high income)Middle East & North Africa (IDA & IBRD countries)Middle incomeMoldovaMongoliaMontenegroMoroccoMozambiqueMyanmarNamibiaNepalNetherlandsNew CaledoniaNew ZealandNicaraguaNigerNigeriaNorth AmericaNorwayOECD membersOmanOther small statesPacific island small statesPakistanPanamaPapua New GuineaParaguayPeruPhilippinesPolandPortugalPost-demographic dividendPre-demographic dividendPuerto RicoQatarRomaniaRussian FederationRwandaSamoaSao Tome and PrincipeSaudi ArabiaSenegalSerbiaSeychellesSierra LeoneSingaporeSlovak RepublicSloveniaSmall statesSolomon IslandsSomaliaSouth AfricaSouth AsiaSouth Asia (IDA & IBRD)South SudanSpainSri LankaSt. LuciaSt. Vincent and the GrenadinesSub-Saharan Africa Sub-Saharan Africa (excluding high income)Sub-Saharan Africa (IDA & IBRD countries)SudanSurinameSwazilandSwedenSwitzerlandSyrian Arab RepublicTajikistanTanzaniaThailandTimor-LesteTogoTongaTrinidad and TobagoTunisiaTurkeyTurkmenistanUgandaUkraineUnited Arab EmiratesUnited KingdomUnited StatesUpper middle incomeUruguayUzbekistanVanuatuVenezuela, RBVietnamVirgin Islands (U.S.)West Bank and GazaWorldYemen, Rep.ZambiaZimbabwe Linea del tempo:
Questa scala temporale mostra un grafico dal 1961 anno al 2016 anno. Guinea. I dati fino ad 1960 anno non disponibili. Il numero di osservazioni attuali secondo i date: 56.
La fonte (nome):
Indicatori dello sviluppo mondiale
La fonte (organizzazione):
World Bank staff estimates based on age distributions of United Nations Population Division's World Population Prospects.
Categorie:
Education, Health
sono stati aggiornati
23 apr 2017 anni
Indicatori delle variazioni dei valori per anni
Minima:
40.403
1 gen 1961 anni
Massimo:
44.423
1 gen 1999 anni
Alla data di osservazione
Valore
Variazione assoluta
La variazione rispetto al valore precedente
1 gen 1961 anni
40.403
+40.403
0.0%
1 gen 1962 anni
40.709
+0.306
0.76%
1 gen 1963 anni
41.057
+0.347
0.85%
1 gen 1964 anni
41.38
+0.324
0.79%
1 gen 1965 anni
41.571
+0.191
0.46%
1 gen 1966 anni
41.588
+0.017
0.04%
1 gen 1967 anni
41.762
+0.174
0.42%
1 gen 1968 anni
41.747
-0.015
-0.03%
1 gen 1969 anni
41.6
-0.147
-0.35%
1 gen 1970 anni
41.397
-0.202
-0.49%
1 gen 1971 anni
41.172
-0.226
-0.55%
1 gen 1972 anni
41.219
+0.047
0.11%
1 gen 1973 anni
41.243
+0.024
0.06%
1 gen 1974 anni
41.242
0.0
0.0%
1 gen 1975 anni
41.209
-0.033
-0.08%
1 gen 1976 anni
41.143
-0.065
-0.16%
1 gen 1977 anni
41.334
+0.19
0.46%
1 gen 1978 anni
41.457
+0.123
0.3%
1 gen 1979 anni
41.545
+0.088
0.21%
1 gen 1980 anni
41.643
+0.098
0.24%
1 gen 1981 anni
41.79
+0.147
0.35%
1 gen 1982 anni
42.093
+0.303
0.73%
1 gen 1983 anni
42.334
+0.241
0.57%
1 gen 1984 anni
42.547
+0.212
0.5%
1 gen 1985 anni
42.743
+0.196
0.46%
1 gen 1986 anni
42.923
+0.18
0.42%
1 gen 1987 anni
43.212
+0.29
0.68%
1 gen 1988 anni
43.406
+0.194
0.45%
1 gen 1989 anni
43.535
+0.129
0.3%
1 gen 1990 anni
43.65
+0.115
0.26%
1 gen 1991 anni
43.804
+0.153
0.35%
1 gen 1992 anni
44.024
+0.22
0.5%
1 gen 1993 anni
44.179
+0.155
0.35%
1 gen 1994 anni
44.284
+0.105
0.24%
1 gen 1995 anni
44.305
+0.021
0.05%
1 gen 1996 anni
44.186
-0.118
-0.27%
1 gen 1997 anni
44.338
+0.151
0.34%
1 gen 1998 anni
44.421
+0.083
0.19%
1 gen 1999 anni
44.423
+0.001
0.0%
1 gen 2000 anni
44.355
-0.068
-0.15%
1 gen 2001 anni
44.24
-0.115
-0.26%
1 gen 2002 anni
44.282
+0.042
0.09%
1 gen 2003 anni
44.266
-0.016
-0.04%
1 gen 2004 anni
44.207
-0.059
-0.13%
1 gen 2005 anni
44.118
-0.088
-0.2%
1 gen 2006 anni
44.015
-0.103
-0.23%
1 gen 2007 anni
43.955
-0.06
-0.14%
1 gen 2008 anni
43.835
-0.12
-0.27%
1 gen 2009 anni
43.679
-0.157
-0.36%
1 gen 2010 anni
43.503
-0.175
-0.4%
1 gen 2011 anni
43.319
-0.184
-0.42%
1 gen 2012 anni
43.207
-0.112
-0.26%
1 gen 2013 anni
43.074
-0.133
-0.31%
1 gen 2014 anni
42.921
-0.153
-0.36%
1 gen 2015 anni
42.741
-0.18
-0.42%
1 gen 2016 anni
42.532
-0.209
-0.49%
Classificazione dei paesi secondo i statistiche attuali per anni


Commenti: