29
/it/
it
AIzaSyAYiBZKx7MnpbEhh9jyipgxe19OcubqV5w
April 1, 2024
254530
Suriname
SUR
true
2
1
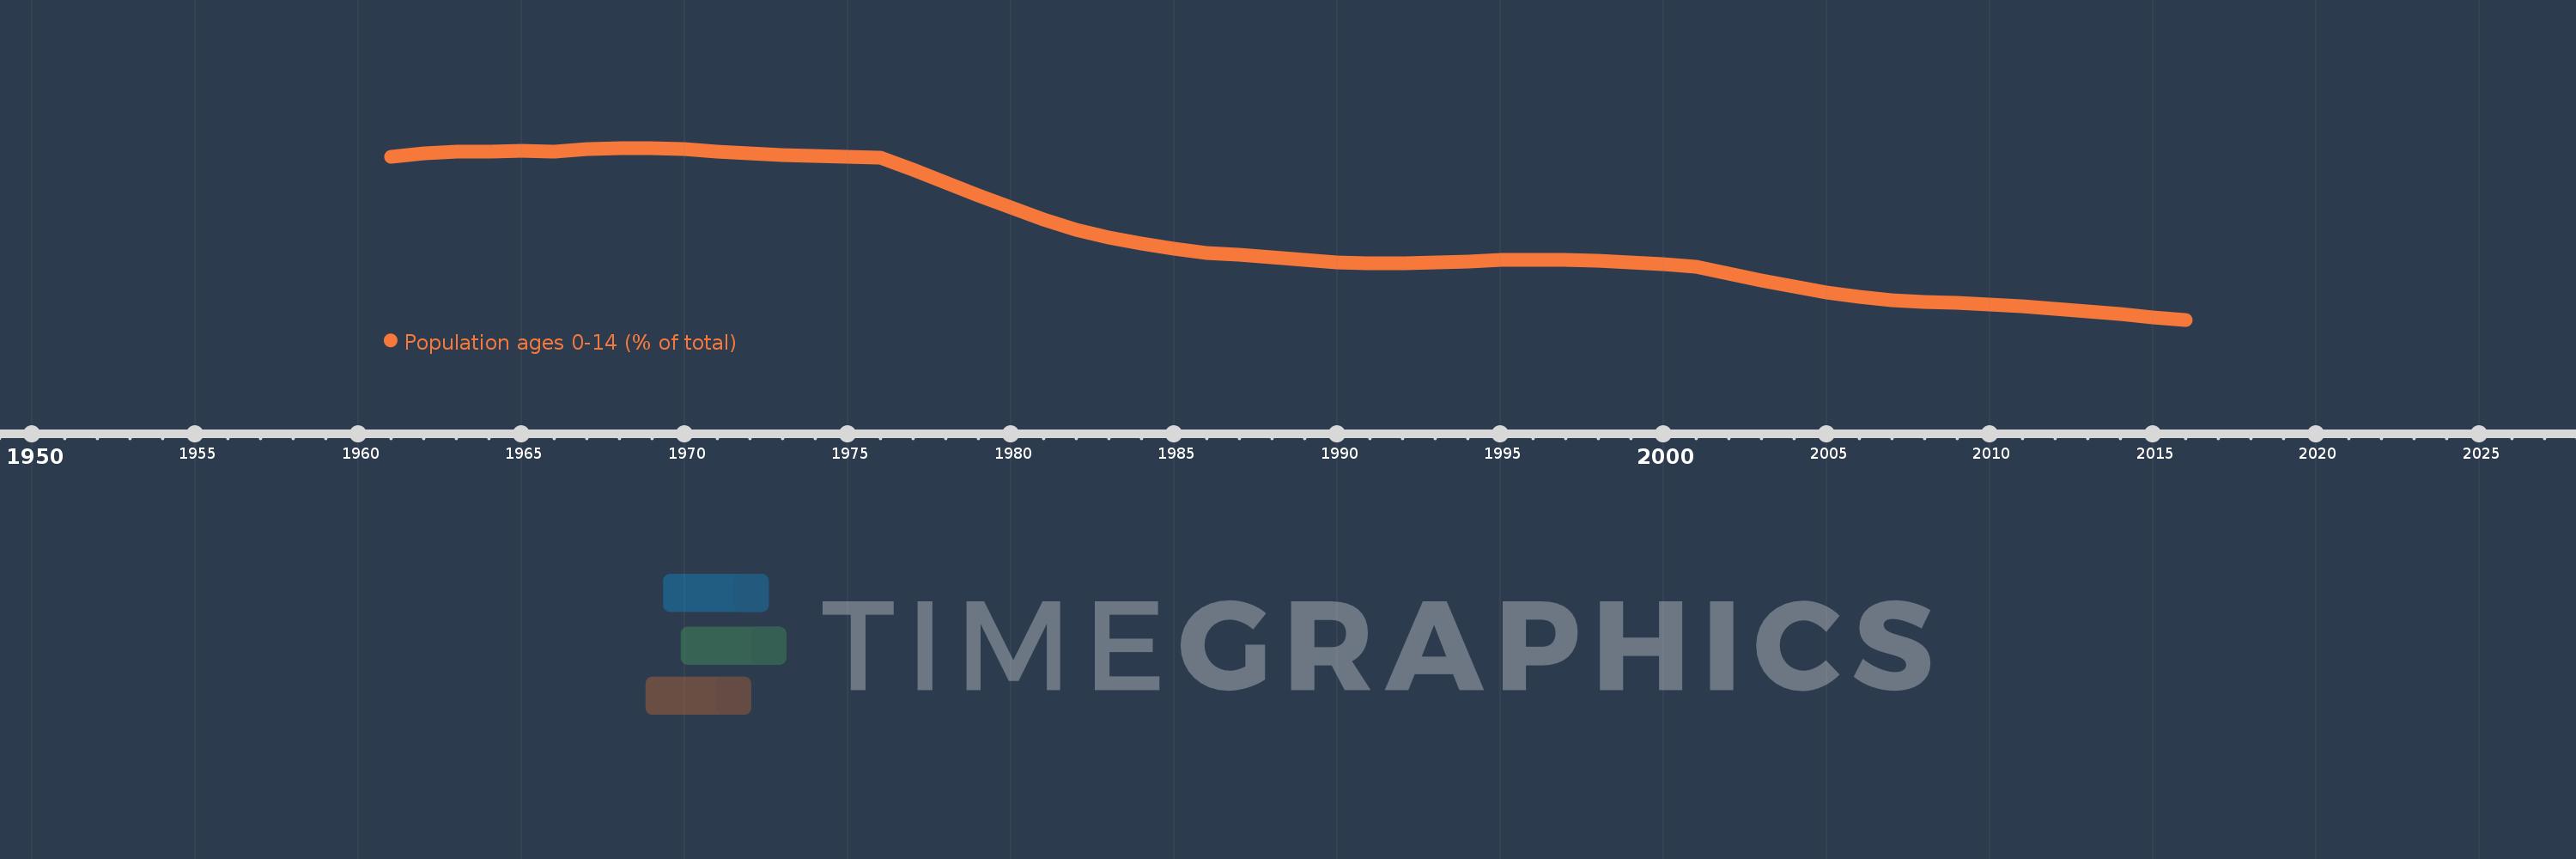
Population ages 0-14 (% of total)
2016,2015,2014,2013,2012,2011,2010,2009,2008,2007,2006,2005,2004,2003,2002,2001,2000,1999,1998,1997,1996,1995,1994,1993,1992,1991,1990,1989,1988,1987,1986,1985,1984,1983,1982,1981,1980,1979,1978,1977,1976,1975,1974,1973,1972,1971,1970,1969,1968,1967,1966,1965,1964,1963,1962,1961
Queste statistiche in altri paesi:
AfghanistanAlbaniaAlgeriaAngolaAntigua and BarbudaArab WorldArgentinaArmeniaArubaAustraliaAustriaAzerbaijanBahamas, TheBahrainBangladeshBarbadosBelarusBelgiumBelizeBeninBhutanBoliviaBosnia and HerzegovinaBotswanaBrazilBrunei DarussalamBulgariaBurkina FasoBurundiCabo VerdeCambodiaCameroonCanadaCaribbean small statesCentral African RepublicCentral Europe and the BalticsChadChannel IslandsChileChinaColombiaComorosCongo, Dem. Rep.Congo, Rep.Costa RicaCote d'IvoireCroatiaCubaCuracaoCyprusCzech RepublicDenmarkDjiboutiDominican RepublicEarly-demographic dividendEast Asia & PacificEast Asia & Pacific (excluding high income)East Asia & Pacific (IDA & IBRD countries)EcuadorEgypt, Arab Rep.El SalvadorEquatorial GuineaEritreaEstoniaEthiopiaEuro areaEurope & Central AsiaEurope & Central Asia (excluding high income)Europe & Central Asia (IDA & IBRD countries)European UnionFijiFinlandFragile and conflict affected situationsFranceFrench PolynesiaGabonGambia, TheGeorgiaGermanyGhanaGreeceGrenadaGuamGuatemalaGuineaGuinea-BissauGuyanaHaitiHeavily indebted poor countries (HIPC)High incomeHondurasHong Kong SAR, ChinaHungaryIBRD onlyIcelandIDA & IBRD totalIDA blendIDA onlyIDA totalIndiaIndonesiaIran, Islamic Rep.IraqIrelandIsraelItalyJamaicaJapanJordanKazakhstanKenyaKiribatiKorea, Dem. People’s Rep.Korea, Rep.KosovoKuwaitKyrgyz RepublicLao PDRLate-demographic dividendLatin America & Caribbean Latin America & Caribbean (excluding high income)Latin America & the Caribbean (IDA & IBRD countries)LatviaLeast developed countries: UN classificationLebanonLesothoLiberiaLibyaLithuaniaLow & middle incomeLow incomeLower middle incomeLuxembourgMacao SAR, ChinaMacedonia, FYRMadagascarMalawiMalaysiaMaldivesMaliMaltaMauritaniaMauritiusMexicoMicronesia, Fed. Sts.Middle East & North AfricaMiddle East & North Africa (excluding high income)Middle East & North Africa (IDA & IBRD countries)Middle incomeMoldovaMongoliaMontenegroMoroccoMozambiqueMyanmarNamibiaNepalNetherlandsNew CaledoniaNew ZealandNicaraguaNigerNigeriaNorth AmericaNorwayOECD membersOmanOther small statesPacific island small statesPakistanPanamaPapua New GuineaParaguayPeruPhilippinesPolandPortugalPost-demographic dividendPre-demographic dividendPuerto RicoQatarRomaniaRussian FederationRwandaSamoaSao Tome and PrincipeSaudi ArabiaSenegalSerbiaSeychellesSierra LeoneSingaporeSlovak RepublicSloveniaSmall statesSolomon IslandsSomaliaSouth AfricaSouth AsiaSouth Asia (IDA & IBRD)South SudanSpainSri LankaSt. LuciaSt. Vincent and the GrenadinesSub-Saharan Africa Sub-Saharan Africa (excluding high income)Sub-Saharan Africa (IDA & IBRD countries)SudanSurinameSwazilandSwedenSwitzerlandSyrian Arab RepublicTajikistanTanzaniaThailandTimor-LesteTogoTongaTrinidad and TobagoTunisiaTurkeyTurkmenistanUgandaUkraineUnited Arab EmiratesUnited KingdomUnited StatesUpper middle incomeUruguayUzbekistanVanuatuVenezuela, RBVietnamVirgin Islands (U.S.)West Bank and GazaWorldYemen, Rep.ZambiaZimbabwe Linea del tempo:
Questa scala temporale mostra un grafico dal 1961 anno al 2016 anno. Suriname. I dati fino ad 1960 anno non disponibili. Il numero di osservazioni attuali secondo i date: 56.
La fonte (nome):
Indicatori dello sviluppo mondiale
La fonte (organizzazione):
World Bank staff estimates based on age distributions of United Nations Population Division's World Population Prospects.
Categorie:
Education, Health
sono stati aggiornati
23 apr 2017 anni
Indicatori delle variazioni dei valori per anni
Minima:
26.782
1 gen 2016 anni
Massimo:
48.677
1 gen 1969 anni
Alla data di osservazione
Valore
Variazione assoluta
La variazione rispetto al valore precedente
1 gen 1961 anni
47.589
+47.589
0.0%
1 gen 1962 anni
47.944
+0.355
0.74%
1 gen 1963 anni
48.152
+0.208
0.43%
1 gen 1964 anni
48.248
+0.096
0.2%
1 gen 1965 anni
48.269
+0.022
0.04%
1 gen 1966 anni
48.232
-0.038
-0.08%
1 gen 1967 anni
48.525
+0.293
0.61%
1 gen 1968 anni
48.674
+0.148
0.31%
1 gen 1969 anni
48.677
+0.003
0.01%
1 gen 1970 anni
48.534
-0.143
-0.29%
1 gen 1971 anni
48.244
-0.29
-0.6%
1 gen 1972 anni
47.969
-0.276
-0.57%
1 gen 1973 anni
47.763
-0.206
-0.43%
1 gen 1974 anni
47.621
-0.142
-0.3%
1 gen 1975 anni
47.531
-0.09
-0.19%
1 gen 1976 anni
47.454
-0.077
-0.16%
1 gen 1977 anni
45.891
-1.563
-3.29%
1 gen 1978 anni
44.296
-1.595
-3.47%
1 gen 1979 anni
42.66
-1.637
-3.69%
1 gen 1980 anni
41.05
-1.61
-3.77%
1 gen 1981 anni
39.571
-1.479
-3.6%
1 gen 1982 anni
38.233
-1.338
-3.38%
1 gen 1983 anni
37.23
-1.003
-2.62%
1 gen 1984 anni
36.478
-0.752
-2.02%
1 gen 1985 anni
35.847
-0.632
-1.73%
1 gen 1986 anni
35.272
-0.575
-1.6%
1 gen 1987 anni
35.112
-0.16
-0.45%
1 gen 1988 anni
34.762
-0.349
-0.99%
1 gen 1989 anni
34.361
-0.402
-1.16%
1 gen 1990 anni
34.079
-0.281
-0.82%
1 gen 1991 anni
33.983
-0.097
-0.28%
1 gen 1992 anni
33.949
-0.034
-0.1%
1 gen 1993 anni
34.051
+0.102
0.3%
1 gen 1994 anni
34.23
+0.179
0.53%
1 gen 1995 anni
34.37
+0.14
0.41%
1 gen 1996 anni
34.409
+0.039
0.11%
1 gen 1997 anni
34.364
-0.044
-0.13%
1 gen 1998 anni
34.271
-0.094
-0.27%
1 gen 1999 anni
34.106
-0.164
-0.48%
1 gen 2000 anni
33.87
-0.236
-0.69%
1 gen 2001 anni
33.562
-0.307
-0.91%
1 gen 2002 anni
32.704
-0.858
-2.56%
1 gen 2003 anni
31.821
-0.883
-2.7%
1 gen 2004 anni
30.978
-0.843
-2.65%
1 gen 2005 anni
30.245
-0.733
-2.37%
1 gen 2006 anni
29.659
-0.586
-1.94%
1 gen 2007 anni
29.316
-0.343
-1.16%
1 gen 2008 anni
29.1
-0.216
-0.74%
1 gen 2009 anni
28.936
-0.164
-0.56%
1 gen 2010 anni
28.738
-0.198
-0.68%
1 gen 2011 anni
28.471
-0.267
-0.93%
1 gen 2012 anni
28.193
-0.277
-0.97%
1 gen 2013 anni
27.863
-0.33
-1.17%
1 gen 2014 anni
27.496
-0.367
-1.32%
1 gen 2015 anni
27.13
-0.367
-1.33%
1 gen 2016 anni
26.782
-0.348
-1.28%
Classificazione dei paesi secondo i statistiche attuali per anni


Commenti: