29
/it/
it
AIzaSyAYiBZKx7MnpbEhh9jyipgxe19OcubqV5w
April 1, 2024
156503
Indonesia
IDN
true
2
1
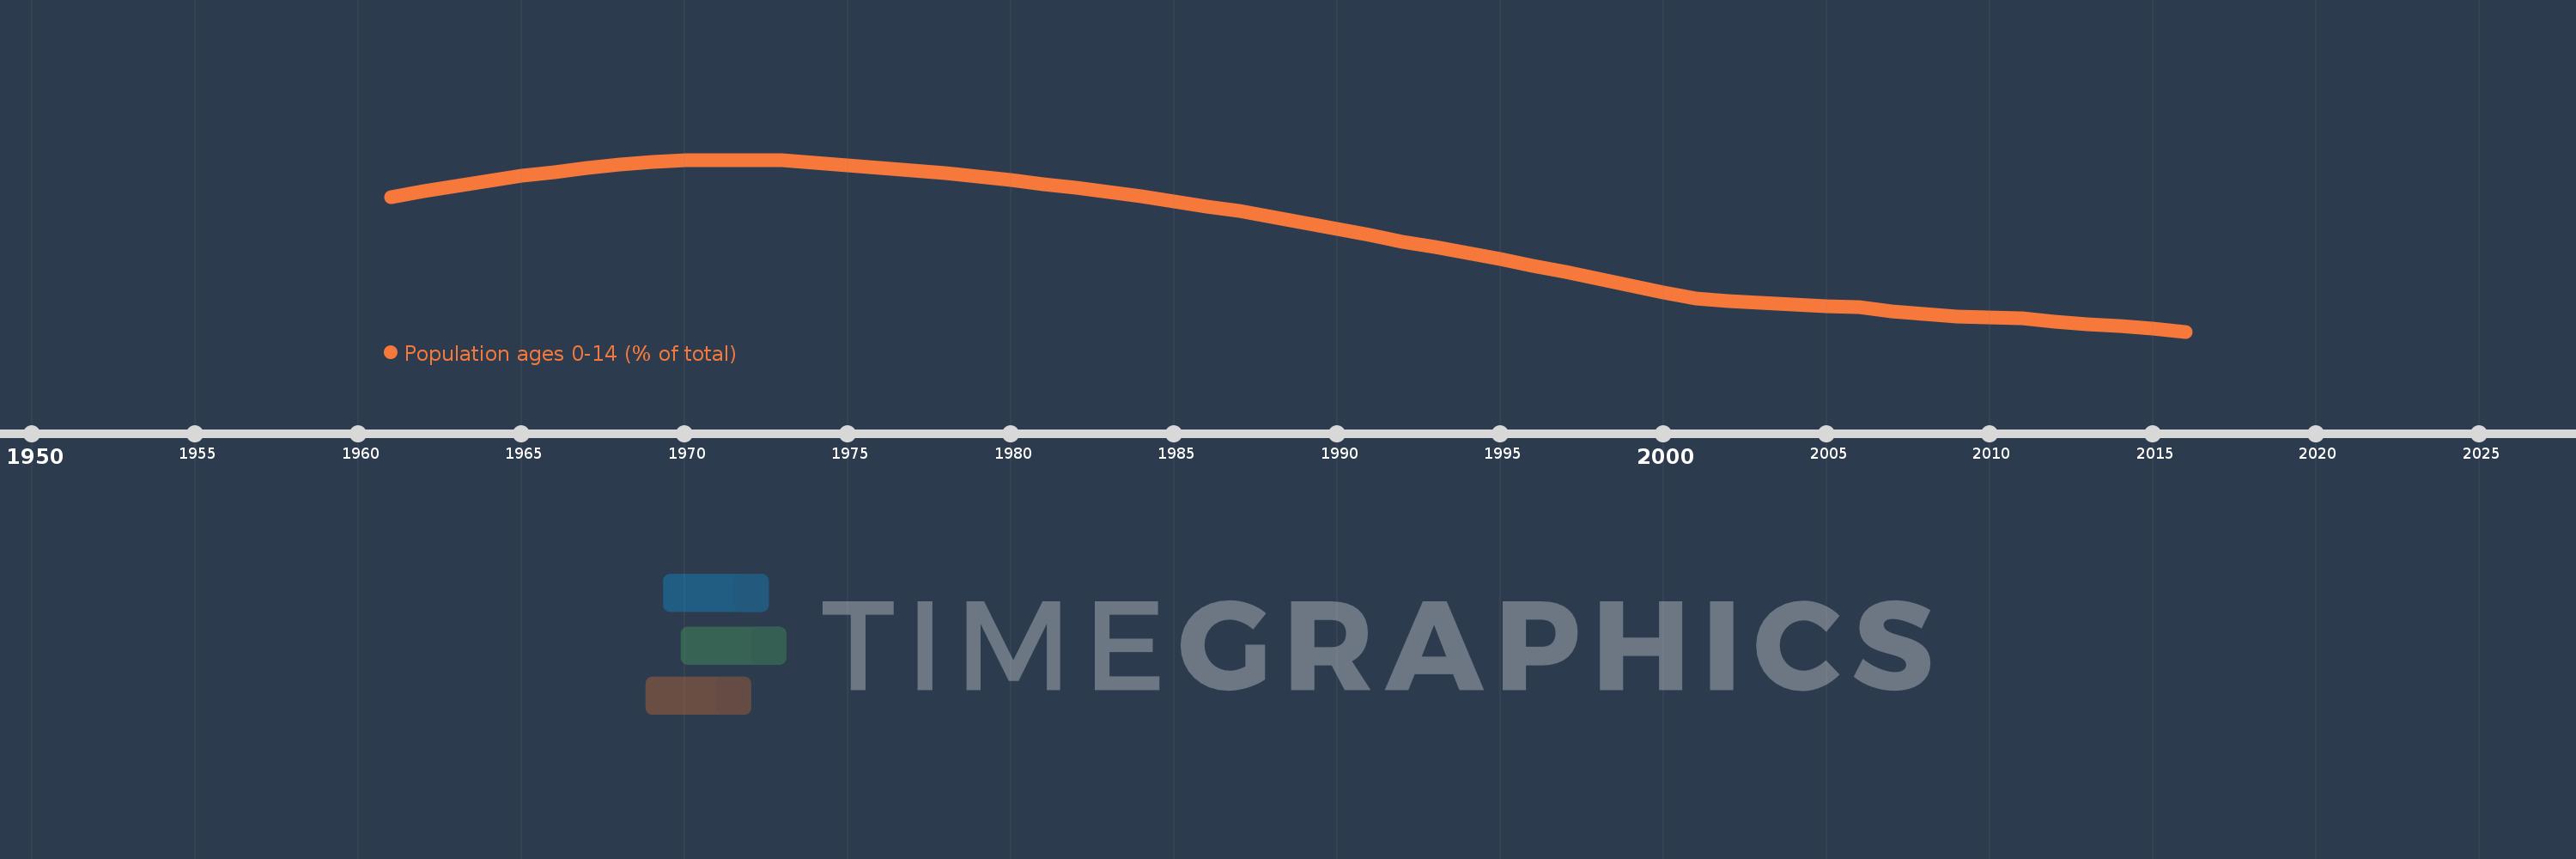
Population ages 0-14 (% of total)
2016,2015,2014,2013,2012,2011,2010,2009,2008,2007,2006,2005,2004,2003,2002,2001,2000,1999,1998,1997,1996,1995,1994,1993,1992,1991,1990,1989,1988,1987,1986,1985,1984,1983,1982,1981,1980,1979,1978,1977,1976,1975,1974,1973,1972,1971,1970,1969,1968,1967,1966,1965,1964,1963,1962,1961
Queste statistiche in altri paesi:
AfghanistanAlbaniaAlgeriaAngolaAntigua and BarbudaArab WorldArgentinaArmeniaArubaAustraliaAustriaAzerbaijanBahamas, TheBahrainBangladeshBarbadosBelarusBelgiumBelizeBeninBhutanBoliviaBosnia and HerzegovinaBotswanaBrazilBrunei DarussalamBulgariaBurkina FasoBurundiCabo VerdeCambodiaCameroonCanadaCaribbean small statesCentral African RepublicCentral Europe and the BalticsChadChannel IslandsChileChinaColombiaComorosCongo, Dem. Rep.Congo, Rep.Costa RicaCote d'IvoireCroatiaCubaCuracaoCyprusCzech RepublicDenmarkDjiboutiDominican RepublicEarly-demographic dividendEast Asia & PacificEast Asia & Pacific (excluding high income)East Asia & Pacific (IDA & IBRD countries)EcuadorEgypt, Arab Rep.El SalvadorEquatorial GuineaEritreaEstoniaEthiopiaEuro areaEurope & Central AsiaEurope & Central Asia (excluding high income)Europe & Central Asia (IDA & IBRD countries)European UnionFijiFinlandFragile and conflict affected situationsFranceFrench PolynesiaGabonGambia, TheGeorgiaGermanyGhanaGreeceGrenadaGuamGuatemalaGuineaGuinea-BissauGuyanaHaitiHeavily indebted poor countries (HIPC)High incomeHondurasHong Kong SAR, ChinaHungaryIBRD onlyIcelandIDA & IBRD totalIDA blendIDA onlyIDA totalIndiaIndonesiaIran, Islamic Rep.IraqIrelandIsraelItalyJamaicaJapanJordanKazakhstanKenyaKiribatiKorea, Dem. People’s Rep.Korea, Rep.KosovoKuwaitKyrgyz RepublicLao PDRLate-demographic dividendLatin America & Caribbean Latin America & Caribbean (excluding high income)Latin America & the Caribbean (IDA & IBRD countries)LatviaLeast developed countries: UN classificationLebanonLesothoLiberiaLibyaLithuaniaLow & middle incomeLow incomeLower middle incomeLuxembourgMacao SAR, ChinaMacedonia, FYRMadagascarMalawiMalaysiaMaldivesMaliMaltaMauritaniaMauritiusMexicoMicronesia, Fed. Sts.Middle East & North AfricaMiddle East & North Africa (excluding high income)Middle East & North Africa (IDA & IBRD countries)Middle incomeMoldovaMongoliaMontenegroMoroccoMozambiqueMyanmarNamibiaNepalNetherlandsNew CaledoniaNew ZealandNicaraguaNigerNigeriaNorth AmericaNorwayOECD membersOmanOther small statesPacific island small statesPakistanPanamaPapua New GuineaParaguayPeruPhilippinesPolandPortugalPost-demographic dividendPre-demographic dividendPuerto RicoQatarRomaniaRussian FederationRwandaSamoaSao Tome and PrincipeSaudi ArabiaSenegalSerbiaSeychellesSierra LeoneSingaporeSlovak RepublicSloveniaSmall statesSolomon IslandsSomaliaSouth AfricaSouth AsiaSouth Asia (IDA & IBRD)South SudanSpainSri LankaSt. LuciaSt. Vincent and the GrenadinesSub-Saharan Africa Sub-Saharan Africa (excluding high income)Sub-Saharan Africa (IDA & IBRD countries)SudanSurinameSwazilandSwedenSwitzerlandSyrian Arab RepublicTajikistanTanzaniaThailandTimor-LesteTogoTongaTrinidad and TobagoTunisiaTurkeyTurkmenistanUgandaUkraineUnited Arab EmiratesUnited KingdomUnited StatesUpper middle incomeUruguayUzbekistanVanuatuVenezuela, RBVietnamVirgin Islands (U.S.)West Bank and GazaWorldYemen, Rep.ZambiaZimbabwe Linea del tempo:
Questa scala temporale mostra un grafico dal 1961 anno al 2016 anno. Indonesia. I dati fino ad 1960 anno non disponibili. Il numero di osservazioni attuali secondo i date: 56.
La fonte (nome):
Indicatori dello sviluppo mondiale
La fonte (organizzazione):
World Bank staff estimates based on age distributions of United Nations Population Division's World Population Prospects.
Categorie:
Education, Health
sono stati aggiornati
23 apr 2017 anni
Indicatori delle variazioni dei valori per anni
Minima:
27.692
1 gen 2016 anni
Massimo:
43.276
1 gen 1972 anni
Alla data di osservazione
Valore
Variazione assoluta
La variazione rispetto al valore precedente
1 gen 1961 anni
39.869
+39.869
0.0%
1 gen 1962 anni
40.418
+0.549
1.38%
1 gen 1963 anni
40.92
+0.502
1.24%
1 gen 1964 anni
41.382
+0.463
1.13%
1 gen 1965 anni
41.801
+0.419
1.01%
1 gen 1966 anni
42.166
+0.365
0.87%
1 gen 1967 anni
42.525
+0.359
0.85%
1 gen 1968 anni
42.835
+0.31
0.73%
1 gen 1969 anni
43.071
+0.236
0.55%
1 gen 1970 anni
43.203
+0.132
0.31%
1 gen 1971 anni
43.222
+0.019
0.04%
1 gen 1972 anni
43.276
+0.055
0.13%
1 gen 1973 anni
43.201
-0.076
-0.17%
1 gen 1974 anni
43.027
-0.173
-0.4%
1 gen 1975 anni
42.801
-0.227
-0.53%
1 gen 1976 anni
42.545
-0.256
-0.6%
1 gen 1977 anni
42.328
-0.216
-0.51%
1 gen 1978 anni
42.073
-0.255
-0.6%
1 gen 1979 anni
41.781
-0.292
-0.69%
1 gen 1980 anni
41.449
-0.332
-0.79%
1 gen 1981 anni
41.079
-0.37
-0.89%
1 gen 1982 anni
40.743
-0.336
-0.82%
1 gen 1983 anni
40.372
-0.37
-0.91%
1 gen 1984 anni
39.968
-0.404
-1.0%
1 gen 1985 anni
39.526
-0.443
-1.11%
1 gen 1986 anni
39.042
-0.484
-1.22%
1 gen 1987 anni
38.605
-0.437
-1.12%
1 gen 1988 anni
38.103
-0.502
-1.3%
1 gen 1989 anni
37.556
-0.547
-1.44%
1 gen 1990 anni
36.994
-0.561
-1.5%
1 gen 1991 anni
36.434
-0.561
-1.52%
1 gen 1992 anni
35.873
-0.561
-1.54%
1 gen 1993 anni
35.34
-0.533
-1.48%
1 gen 1994 anni
34.814
-0.526
-1.49%
1 gen 1995 anni
34.259
-0.555
-1.59%
1 gen 1996 anni
33.66
-0.599
-1.75%
1 gen 1997 anni
33.099
-0.561
-1.67%
1 gen 1998 anni
32.486
-0.612
-1.85%
1 gen 1999 anni
31.849
-0.638
-1.96%
1 gen 2000 anni
31.235
-0.613
-1.93%
1 gen 2001 anni
30.686
-0.549
-1.76%
1 gen 2002 anni
30.456
-0.23
-0.75%
1 gen 2003 anni
30.279
-0.178
-0.58%
1 gen 2004 anni
30.141
-0.138
-0.45%
1 gen 2005 anni
30.022
-0.119
-0.39%
1 gen 2006 anni
29.908
-0.114
-0.38%
1 gen 2007 anni
29.544
-0.364
-1.22%
1 gen 2008 anni
29.263
-0.281
-0.95%
1 gen 2009 anni
29.063
-0.201
-0.69%
1 gen 2010 anni
28.943
-0.12
-0.41%
1 gen 2011 anni
28.885
-0.058
-0.2%
1 gen 2012 anni
28.596
-0.289
-1.0%
1 gen 2013 anni
28.39
-0.207
-0.72%
1 gen 2014 anni
28.208
-0.182
-0.64%
1 gen 2015 anni
27.983
-0.225
-0.8%
1 gen 2016 anni
27.692
-0.29
-1.04%
Classificazione dei paesi secondo i statistiche attuali per anni


Commenti: