29
/it/
it
AIzaSyAYiBZKx7MnpbEhh9jyipgxe19OcubqV5w
April 1, 2024
209676
New Zealand
NZL
true
2
1
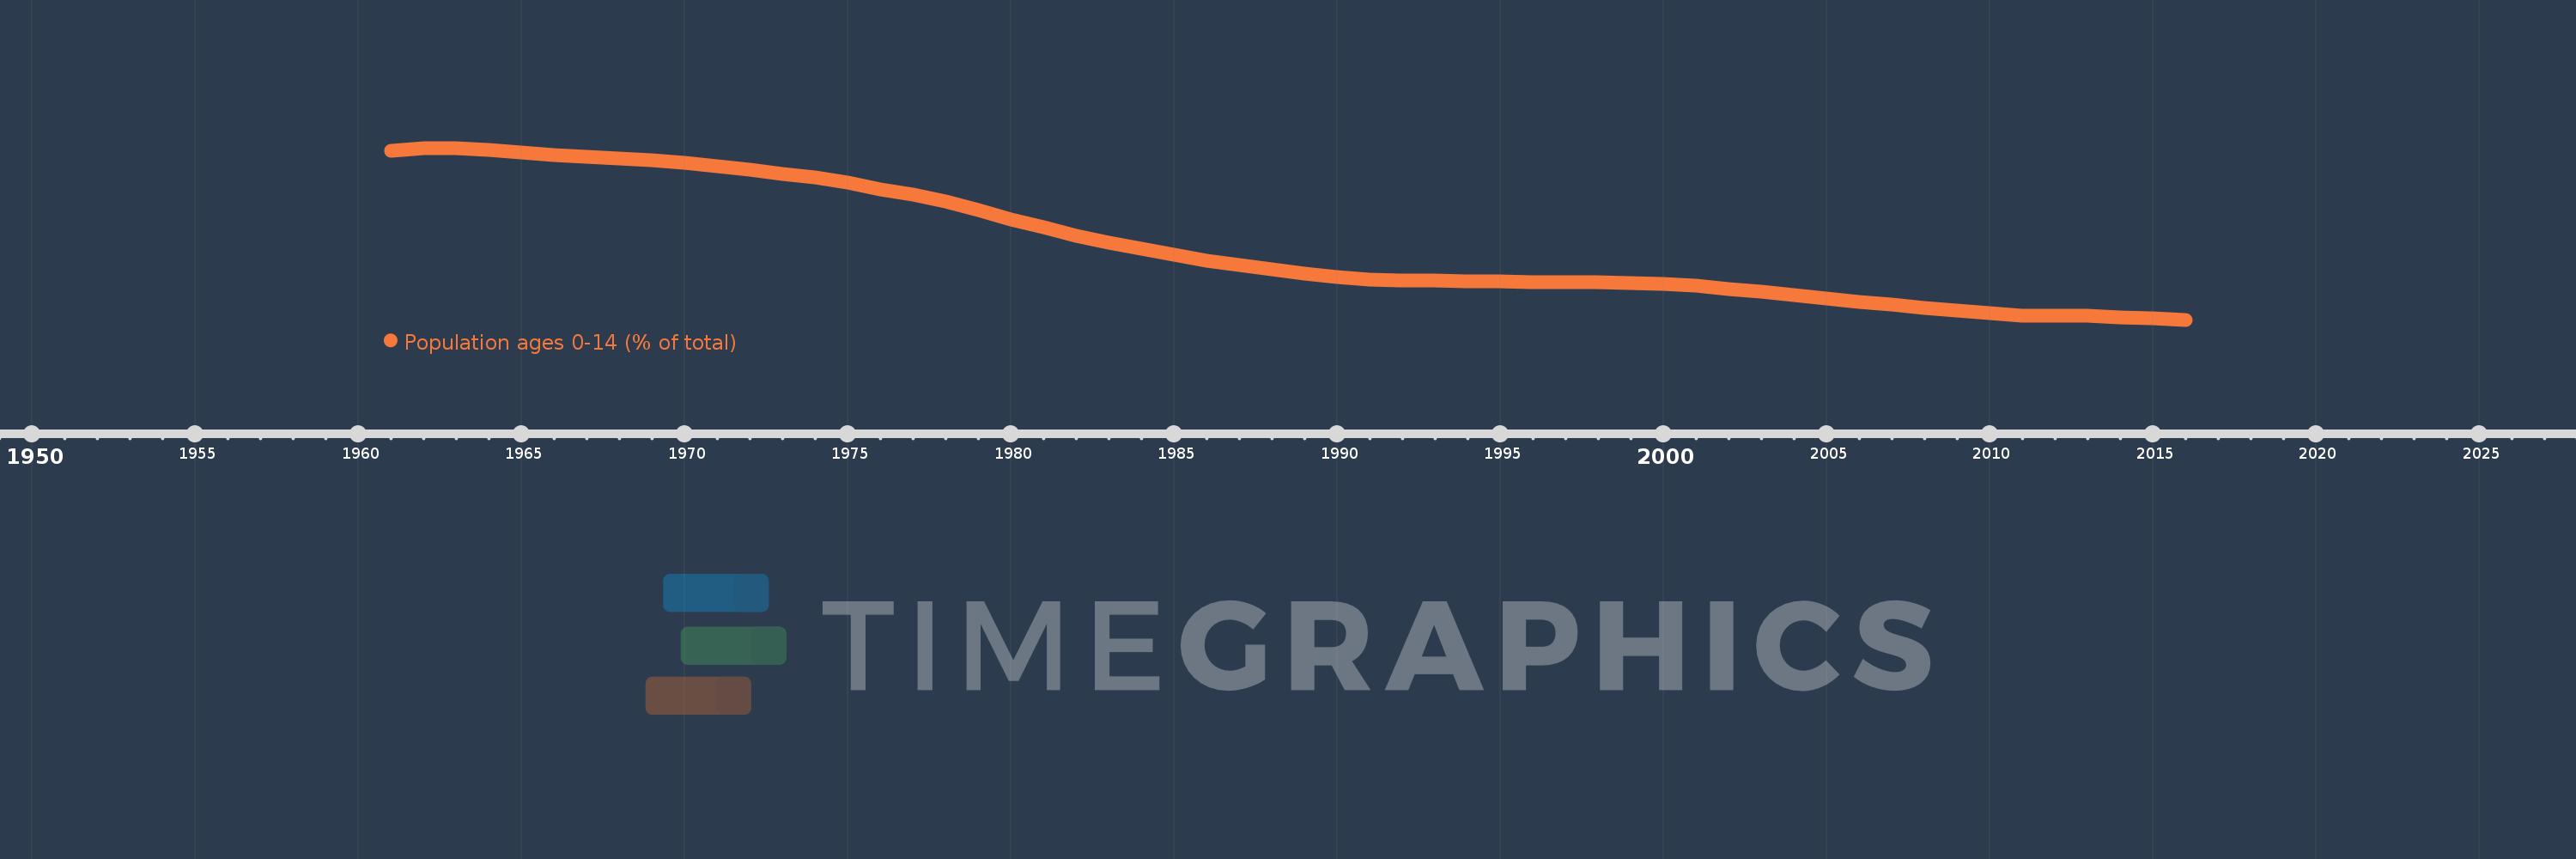
Population ages 0-14 (% of total)
2016,2015,2014,2013,2012,2011,2010,2009,2008,2007,2006,2005,2004,2003,2002,2001,2000,1999,1998,1997,1996,1995,1994,1993,1992,1991,1990,1989,1988,1987,1986,1985,1984,1983,1982,1981,1980,1979,1978,1977,1976,1975,1974,1973,1972,1971,1970,1969,1968,1967,1966,1965,1964,1963,1962,1961
Queste statistiche in altri paesi:
AfghanistanAlbaniaAlgeriaAngolaAntigua and BarbudaArab WorldArgentinaArmeniaArubaAustraliaAustriaAzerbaijanBahamas, TheBahrainBangladeshBarbadosBelarusBelgiumBelizeBeninBhutanBoliviaBosnia and HerzegovinaBotswanaBrazilBrunei DarussalamBulgariaBurkina FasoBurundiCabo VerdeCambodiaCameroonCanadaCaribbean small statesCentral African RepublicCentral Europe and the BalticsChadChannel IslandsChileChinaColombiaComorosCongo, Dem. Rep.Congo, Rep.Costa RicaCote d'IvoireCroatiaCubaCuracaoCyprusCzech RepublicDenmarkDjiboutiDominican RepublicEarly-demographic dividendEast Asia & PacificEast Asia & Pacific (excluding high income)East Asia & Pacific (IDA & IBRD countries)EcuadorEgypt, Arab Rep.El SalvadorEquatorial GuineaEritreaEstoniaEthiopiaEuro areaEurope & Central AsiaEurope & Central Asia (excluding high income)Europe & Central Asia (IDA & IBRD countries)European UnionFijiFinlandFragile and conflict affected situationsFranceFrench PolynesiaGabonGambia, TheGeorgiaGermanyGhanaGreeceGrenadaGuamGuatemalaGuineaGuinea-BissauGuyanaHaitiHeavily indebted poor countries (HIPC)High incomeHondurasHong Kong SAR, ChinaHungaryIBRD onlyIcelandIDA & IBRD totalIDA blendIDA onlyIDA totalIndiaIndonesiaIran, Islamic Rep.IraqIrelandIsraelItalyJamaicaJapanJordanKazakhstanKenyaKiribatiKorea, Dem. People’s Rep.Korea, Rep.KosovoKuwaitKyrgyz RepublicLao PDRLate-demographic dividendLatin America & Caribbean Latin America & Caribbean (excluding high income)Latin America & the Caribbean (IDA & IBRD countries)LatviaLeast developed countries: UN classificationLebanonLesothoLiberiaLibyaLithuaniaLow & middle incomeLow incomeLower middle incomeLuxembourgMacao SAR, ChinaMacedonia, FYRMadagascarMalawiMalaysiaMaldivesMaliMaltaMauritaniaMauritiusMexicoMicronesia, Fed. Sts.Middle East & North AfricaMiddle East & North Africa (excluding high income)Middle East & North Africa (IDA & IBRD countries)Middle incomeMoldovaMongoliaMontenegroMoroccoMozambiqueMyanmarNamibiaNepalNetherlandsNew CaledoniaNew ZealandNicaraguaNigerNigeriaNorth AmericaNorwayOECD membersOmanOther small statesPacific island small statesPakistanPanamaPapua New GuineaParaguayPeruPhilippinesPolandPortugalPost-demographic dividendPre-demographic dividendPuerto RicoQatarRomaniaRussian FederationRwandaSamoaSao Tome and PrincipeSaudi ArabiaSenegalSerbiaSeychellesSierra LeoneSingaporeSlovak RepublicSloveniaSmall statesSolomon IslandsSomaliaSouth AfricaSouth AsiaSouth Asia (IDA & IBRD)South SudanSpainSri LankaSt. LuciaSt. Vincent and the GrenadinesSub-Saharan Africa Sub-Saharan Africa (excluding high income)Sub-Saharan Africa (IDA & IBRD countries)SudanSurinameSwazilandSwedenSwitzerlandSyrian Arab RepublicTajikistanTanzaniaThailandTimor-LesteTogoTongaTrinidad and TobagoTunisiaTurkeyTurkmenistanUgandaUkraineUnited Arab EmiratesUnited KingdomUnited StatesUpper middle incomeUruguayUzbekistanVanuatuVenezuela, RBVietnamVirgin Islands (U.S.)West Bank and GazaWorldYemen, Rep.ZambiaZimbabwe Linea del tempo:
Questa scala temporale mostra un grafico dal 1961 anno al 2016 anno. New Zealand. I dati fino ad 1960 anno non disponibili. Il numero di osservazioni attuali secondo i date: 56.
La fonte (nome):
Indicatori dello sviluppo mondiale
La fonte (organizzazione):
World Bank staff estimates based on age distributions of United Nations Population Division's World Population Prospects.
Categorie:
Education, Health
sono stati aggiornati
23 apr 2017 anni
Indicatori delle variazioni dei valori per anni
Minima:
20.207
1 gen 2016 anni
Massimo:
33.114
1 gen 1962 anni
Alla data di osservazione
Valore
Variazione assoluta
La variazione rispetto al valore precedente
1 gen 1961 anni
32.884
+32.884
0.0%
1 gen 1962 anni
33.114
+0.23
0.7%
1 gen 1963 anni
33.111
-0.002
-0.01%
1 gen 1964 anni
32.96
-0.152
-0.46%
1 gen 1965 anni
32.776
-0.184
-0.56%
1 gen 1966 anni
32.61
-0.166
-0.51%
1 gen 1967 anni
32.466
-0.144
-0.44%
1 gen 1968 anni
32.338
-0.127
-0.39%
1 gen 1969 anni
32.195
-0.144
-0.44%
1 gen 1970 anni
32.001
-0.194
-0.6%
1 gen 1971 anni
31.757
-0.244
-0.76%
1 gen 1972 anni
31.455
-0.301
-0.95%
1 gen 1973 anni
31.174
-0.281
-0.89%
1 gen 1974 anni
30.872
-0.302
-0.97%
1 gen 1975 anni
30.49
-0.381
-1.24%
1 gen 1976 anni
29.99
-0.5
-1.64%
1 gen 1977 anni
29.628
-0.363
-1.21%
1 gen 1978 anni
29.09
-0.537
-1.81%
1 gen 1979 anni
28.431
-0.659
-2.27%
1 gen 1980 anni
27.769
-0.662
-2.33%
1 gen 1981 anni
27.188
-0.582
-2.1%
1 gen 1982 anni
26.511
-0.677
-2.49%
1 gen 1983 anni
25.986
-0.525
-1.98%
1 gen 1984 anni
25.547
-0.439
-1.69%
1 gen 1985 anni
25.105
-0.442
-1.73%
1 gen 1986 anni
24.633
-0.472
-1.88%
1 gen 1987 anni
24.309
-0.323
-1.31%
1 gen 1988 anni
23.979
-0.33
-1.36%
1 gen 1989 anni
23.658
-0.321
-1.34%
1 gen 1990 anni
23.402
-0.256
-1.08%
1 gen 1991 anni
23.248
-0.154
-0.66%
1 gen 1992 anni
23.175
-0.073
-0.32%
1 gen 1993 anni
23.132
-0.044
-0.19%
1 gen 1994 anni
23.106
-0.025
-0.11%
1 gen 1995 anni
23.078
-0.029
-0.12%
1 gen 1996 anni
23.031
-0.046
-0.2%
1 gen 1997 anni
23.05
+0.019
0.08%
1 gen 1998 anni
23.047
-0.003
-0.01%
1 gen 1999 anni
22.992
-0.055
-0.24%
1 gen 2000 anni
22.885
-0.107
-0.47%
1 gen 2001 anni
22.746
-0.139
-0.61%
1 gen 2002 anni
22.511
-0.235
-1.03%
1 gen 2003 anni
22.292
-0.219
-0.97%
1 gen 2004 anni
22.069
-0.223
-1.0%
1 gen 2005 anni
21.826
-0.243
-1.1%
1 gen 2006 anni
21.565
-0.261
-1.2%
1 gen 2007 anni
21.332
-0.233
-1.08%
1 gen 2008 anni
21.112
-0.219
-1.03%
1 gen 2009 anni
20.907
-0.205
-0.97%
1 gen 2010 anni
20.709
-0.198
-0.95%
1 gen 2011 anni
20.509
-0.2
-0.97%
1 gen 2012 anni
20.527
+0.018
0.09%
1 gen 2013 anni
20.48
-0.048
-0.23%
1 gen 2014 anni
20.39
-0.09
-0.44%
1 gen 2015 anni
20.293
-0.097
-0.48%
1 gen 2016 anni
20.207
-0.086
-0.42%
Classificazione dei paesi secondo i statistiche attuali per anni


Commenti: