29
/it/
it
AIzaSyAYiBZKx7MnpbEhh9jyipgxe19OcubqV5w
April 1, 2024
187002
Malawi
MWI
true
2
1
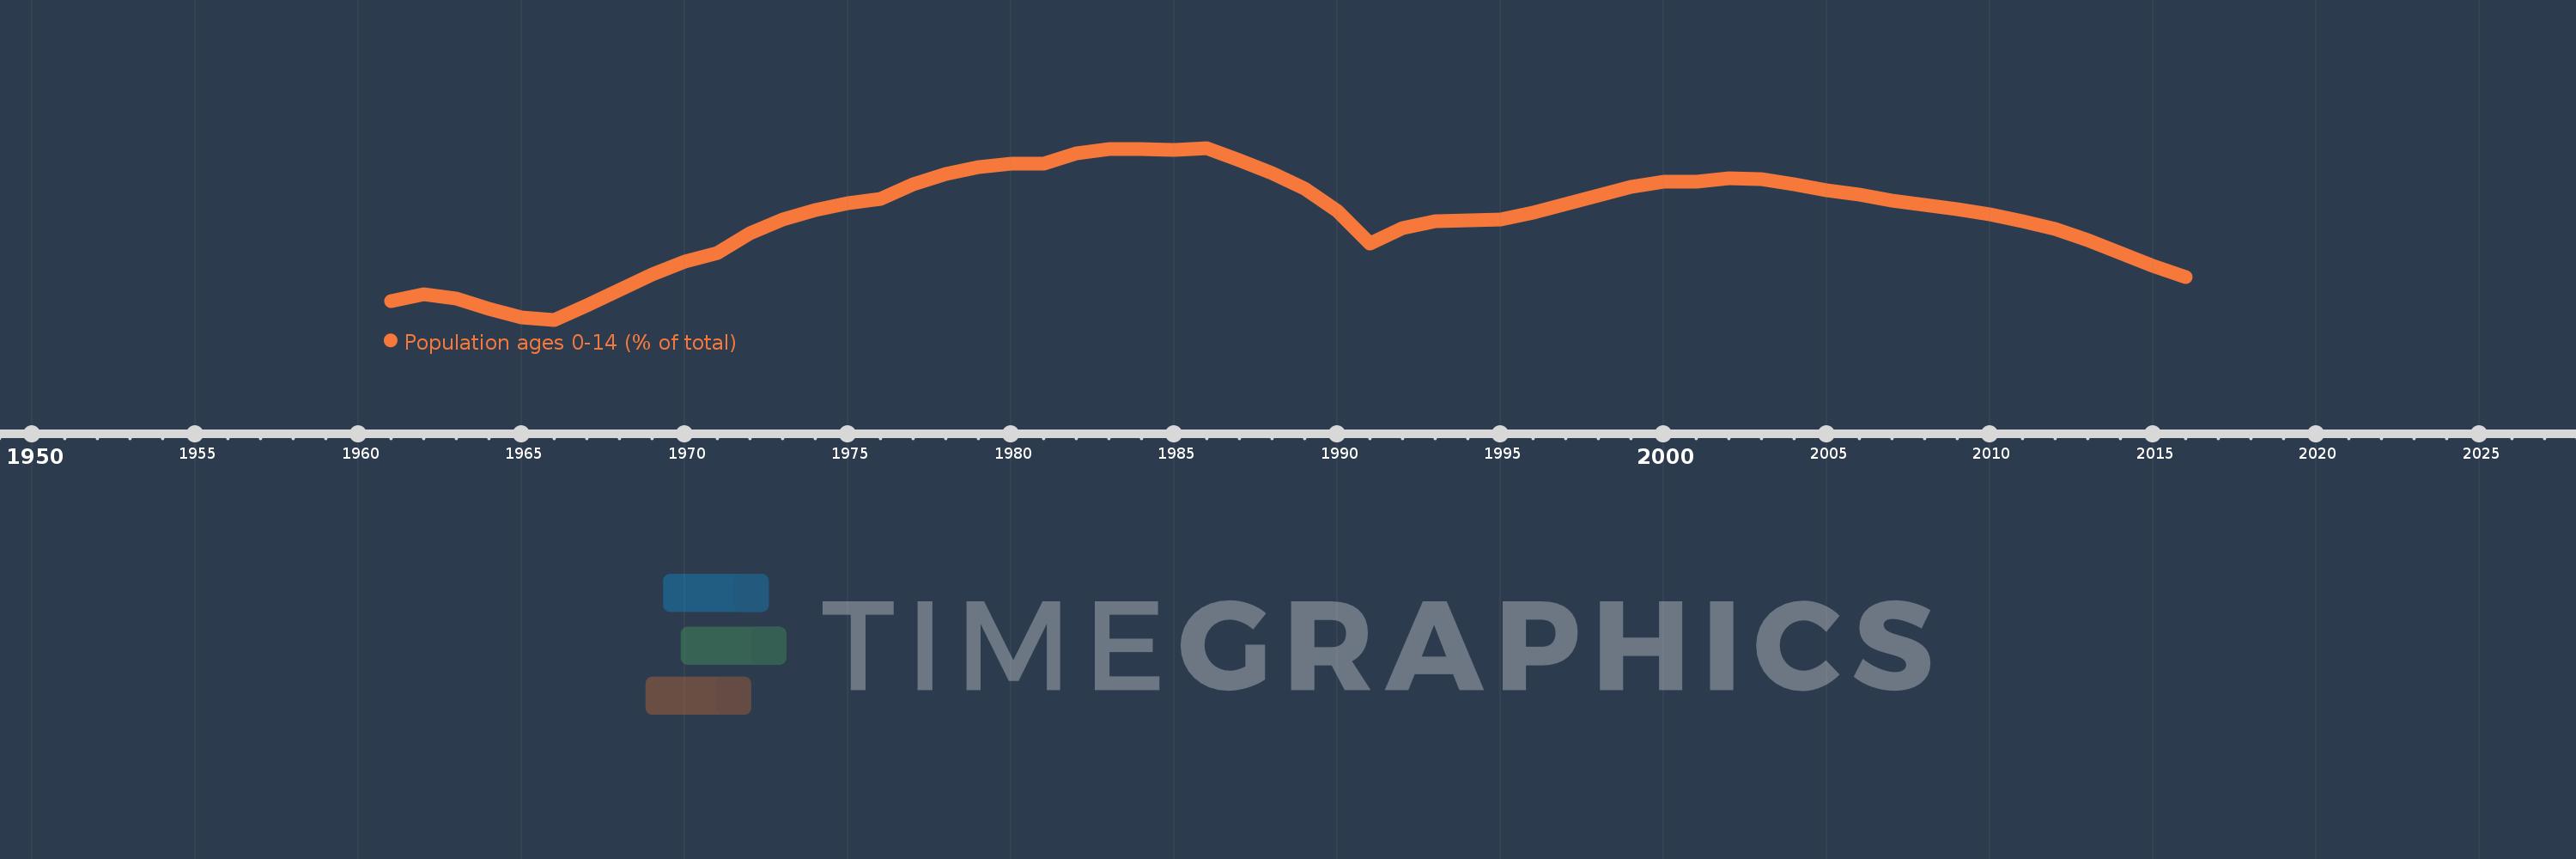
Population ages 0-14 (% of total)
2016,2015,2014,2013,2012,2011,2010,2009,2008,2007,2006,2005,2004,2003,2002,2001,2000,1999,1998,1997,1996,1995,1994,1993,1992,1991,1990,1989,1988,1987,1986,1985,1984,1983,1982,1981,1980,1979,1978,1977,1976,1975,1974,1973,1972,1971,1970,1969,1968,1967,1966,1965,1964,1963,1962,1961
Queste statistiche in altri paesi:
AfghanistanAlbaniaAlgeriaAngolaAntigua and BarbudaArab WorldArgentinaArmeniaArubaAustraliaAustriaAzerbaijanBahamas, TheBahrainBangladeshBarbadosBelarusBelgiumBelizeBeninBhutanBoliviaBosnia and HerzegovinaBotswanaBrazilBrunei DarussalamBulgariaBurkina FasoBurundiCabo VerdeCambodiaCameroonCanadaCaribbean small statesCentral African RepublicCentral Europe and the BalticsChadChannel IslandsChileChinaColombiaComorosCongo, Dem. Rep.Congo, Rep.Costa RicaCote d'IvoireCroatiaCubaCuracaoCyprusCzech RepublicDenmarkDjiboutiDominican RepublicEarly-demographic dividendEast Asia & PacificEast Asia & Pacific (excluding high income)East Asia & Pacific (IDA & IBRD countries)EcuadorEgypt, Arab Rep.El SalvadorEquatorial GuineaEritreaEstoniaEthiopiaEuro areaEurope & Central AsiaEurope & Central Asia (excluding high income)Europe & Central Asia (IDA & IBRD countries)European UnionFijiFinlandFragile and conflict affected situationsFranceFrench PolynesiaGabonGambia, TheGeorgiaGermanyGhanaGreeceGrenadaGuamGuatemalaGuineaGuinea-BissauGuyanaHaitiHeavily indebted poor countries (HIPC)High incomeHondurasHong Kong SAR, ChinaHungaryIBRD onlyIcelandIDA & IBRD totalIDA blendIDA onlyIDA totalIndiaIndonesiaIran, Islamic Rep.IraqIrelandIsraelItalyJamaicaJapanJordanKazakhstanKenyaKiribatiKorea, Dem. People’s Rep.Korea, Rep.KosovoKuwaitKyrgyz RepublicLao PDRLate-demographic dividendLatin America & Caribbean Latin America & Caribbean (excluding high income)Latin America & the Caribbean (IDA & IBRD countries)LatviaLeast developed countries: UN classificationLebanonLesothoLiberiaLibyaLithuaniaLow & middle incomeLow incomeLower middle incomeLuxembourgMacao SAR, ChinaMacedonia, FYRMadagascarMalawiMalaysiaMaldivesMaliMaltaMauritaniaMauritiusMexicoMicronesia, Fed. Sts.Middle East & North AfricaMiddle East & North Africa (excluding high income)Middle East & North Africa (IDA & IBRD countries)Middle incomeMoldovaMongoliaMontenegroMoroccoMozambiqueMyanmarNamibiaNepalNetherlandsNew CaledoniaNew ZealandNicaraguaNigerNigeriaNorth AmericaNorwayOECD membersOmanOther small statesPacific island small statesPakistanPanamaPapua New GuineaParaguayPeruPhilippinesPolandPortugalPost-demographic dividendPre-demographic dividendPuerto RicoQatarRomaniaRussian FederationRwandaSamoaSao Tome and PrincipeSaudi ArabiaSenegalSerbiaSeychellesSierra LeoneSingaporeSlovak RepublicSloveniaSmall statesSolomon IslandsSomaliaSouth AfricaSouth AsiaSouth Asia (IDA & IBRD)South SudanSpainSri LankaSt. LuciaSt. Vincent and the GrenadinesSub-Saharan Africa Sub-Saharan Africa (excluding high income)Sub-Saharan Africa (IDA & IBRD countries)SudanSurinameSwazilandSwedenSwitzerlandSyrian Arab RepublicTajikistanTanzaniaThailandTimor-LesteTogoTongaTrinidad and TobagoTunisiaTurkeyTurkmenistanUgandaUkraineUnited Arab EmiratesUnited KingdomUnited StatesUpper middle incomeUruguayUzbekistanVanuatuVenezuela, RBVietnamVirgin Islands (U.S.)West Bank and GazaWorldYemen, Rep.ZambiaZimbabwe Linea del tempo:
Questa scala temporale mostra un grafico dal 1961 anno al 2016 anno. Malawi. I dati fino ad 1960 anno non disponibili. Il numero di osservazioni attuali secondo i date: 56.
La fonte (nome):
Indicatori dello sviluppo mondiale
La fonte (organizzazione):
World Bank staff estimates based on age distributions of United Nations Population Division's World Population Prospects.
Categorie:
Education, Health
sono stati aggiornati
23 apr 2017 anni
Indicatori delle variazioni dei valori per anni
Minima:
44.362
1 gen 1966 anni
Massimo:
47.535
1 gen 1986 anni
Alla data di osservazione
Valore
Variazione assoluta
La variazione rispetto al valore precedente
1 gen 1961 anni
44.708
+44.708
0.0%
1 gen 1962 anni
44.84
+0.132
0.29%
1 gen 1963 anni
44.755
-0.085
-0.19%
1 gen 1964 anni
44.563
-0.191
-0.43%
1 gen 1965 anni
44.412
-0.152
-0.34%
1 gen 1966 anni
44.362
-0.05
-0.11%
1 gen 1967 anni
44.621
+0.259
0.58%
1 gen 1968 anni
44.906
+0.284
0.64%
1 gen 1969 anni
45.195
+0.289
0.64%
1 gen 1970 anni
45.435
+0.241
0.53%
1 gen 1971 anni
45.6
+0.165
0.36%
1 gen 1972 anni
45.965
+0.364
0.8%
1 gen 1973 anni
46.217
+0.252
0.55%
1 gen 1974 anni
46.387
+0.17
0.37%
1 gen 1975 anni
46.509
+0.122
0.26%
1 gen 1976 anni
46.598
+0.09
0.19%
1 gen 1977 anni
46.859
+0.261
0.56%
1 gen 1978 anni
47.048
+0.189
0.4%
1 gen 1979 anni
47.176
+0.128
0.27%
1 gen 1980 anni
47.243
+0.067
0.14%
1 gen 1981 anni
47.245
+0.002
0.0%
1 gen 1982 anni
47.44
+0.195
0.41%
1 gen 1983 anni
47.513
+0.073
0.15%
1 gen 1984 anni
47.51
-0.003
-0.01%
1 gen 1985 anni
47.501
-0.009
-0.02%
1 gen 1986 anni
47.535
+0.034
0.07%
1 gen 1987 anni
47.314
-0.22
-0.46%
1 gen 1988 anni
47.075
-0.239
-0.51%
1 gen 1989 anni
46.788
-0.287
-0.61%
1 gen 1990 anni
46.375
-0.413
-0.88%
1 gen 1991 anni
45.774
-0.6
-1.29%
1 gen 1992 anni
46.057
+0.282
0.62%
1 gen 1993 anni
46.179
+0.122
0.27%
1 gen 1994 anni
46.196
+0.017
0.04%
1 gen 1995 anni
46.221
+0.025
0.05%
1 gen 1996 anni
46.341
+0.12
0.26%
1 gen 1997 anni
46.498
+0.157
0.34%
1 gen 1998 anni
46.656
+0.158
0.34%
1 gen 1999 anni
46.811
+0.155
0.33%
1 gen 2000 anni
46.907
+0.096
0.21%
1 gen 2001 anni
46.909
+0.002
0.0%
1 gen 2002 anni
46.981
+0.072
0.15%
1 gen 2003 anni
46.952
-0.029
-0.06%
1 gen 2004 anni
46.859
-0.093
-0.2%
1 gen 2005 anni
46.757
-0.103
-0.22%
1 gen 2006 anni
46.675
-0.082
-0.17%
1 gen 2007 anni
46.561
-0.114
-0.24%
1 gen 2008 anni
46.476
-0.085
-0.18%
1 gen 2009 anni
46.406
-0.07
-0.15%
1 gen 2010 anni
46.316
-0.09
-0.19%
1 gen 2011 anni
46.189
-0.127
-0.27%
1 gen 2012 anni
46.045
-0.143
-0.31%
1 gen 2013 anni
45.834
-0.211
-0.46%
1 gen 2014 anni
45.591
-0.243
-0.53%
1 gen 2015 anni
45.361
-0.231
-0.51%
1 gen 2016 anni
45.157
-0.204
-0.45%
Classificazione dei paesi secondo i statistiche attuali per anni


Commenti: