29
/it/
it
AIzaSyAYiBZKx7MnpbEhh9jyipgxe19OcubqV5w
April 1, 2024
122645
Dominican Republic
DOM
true
2
1
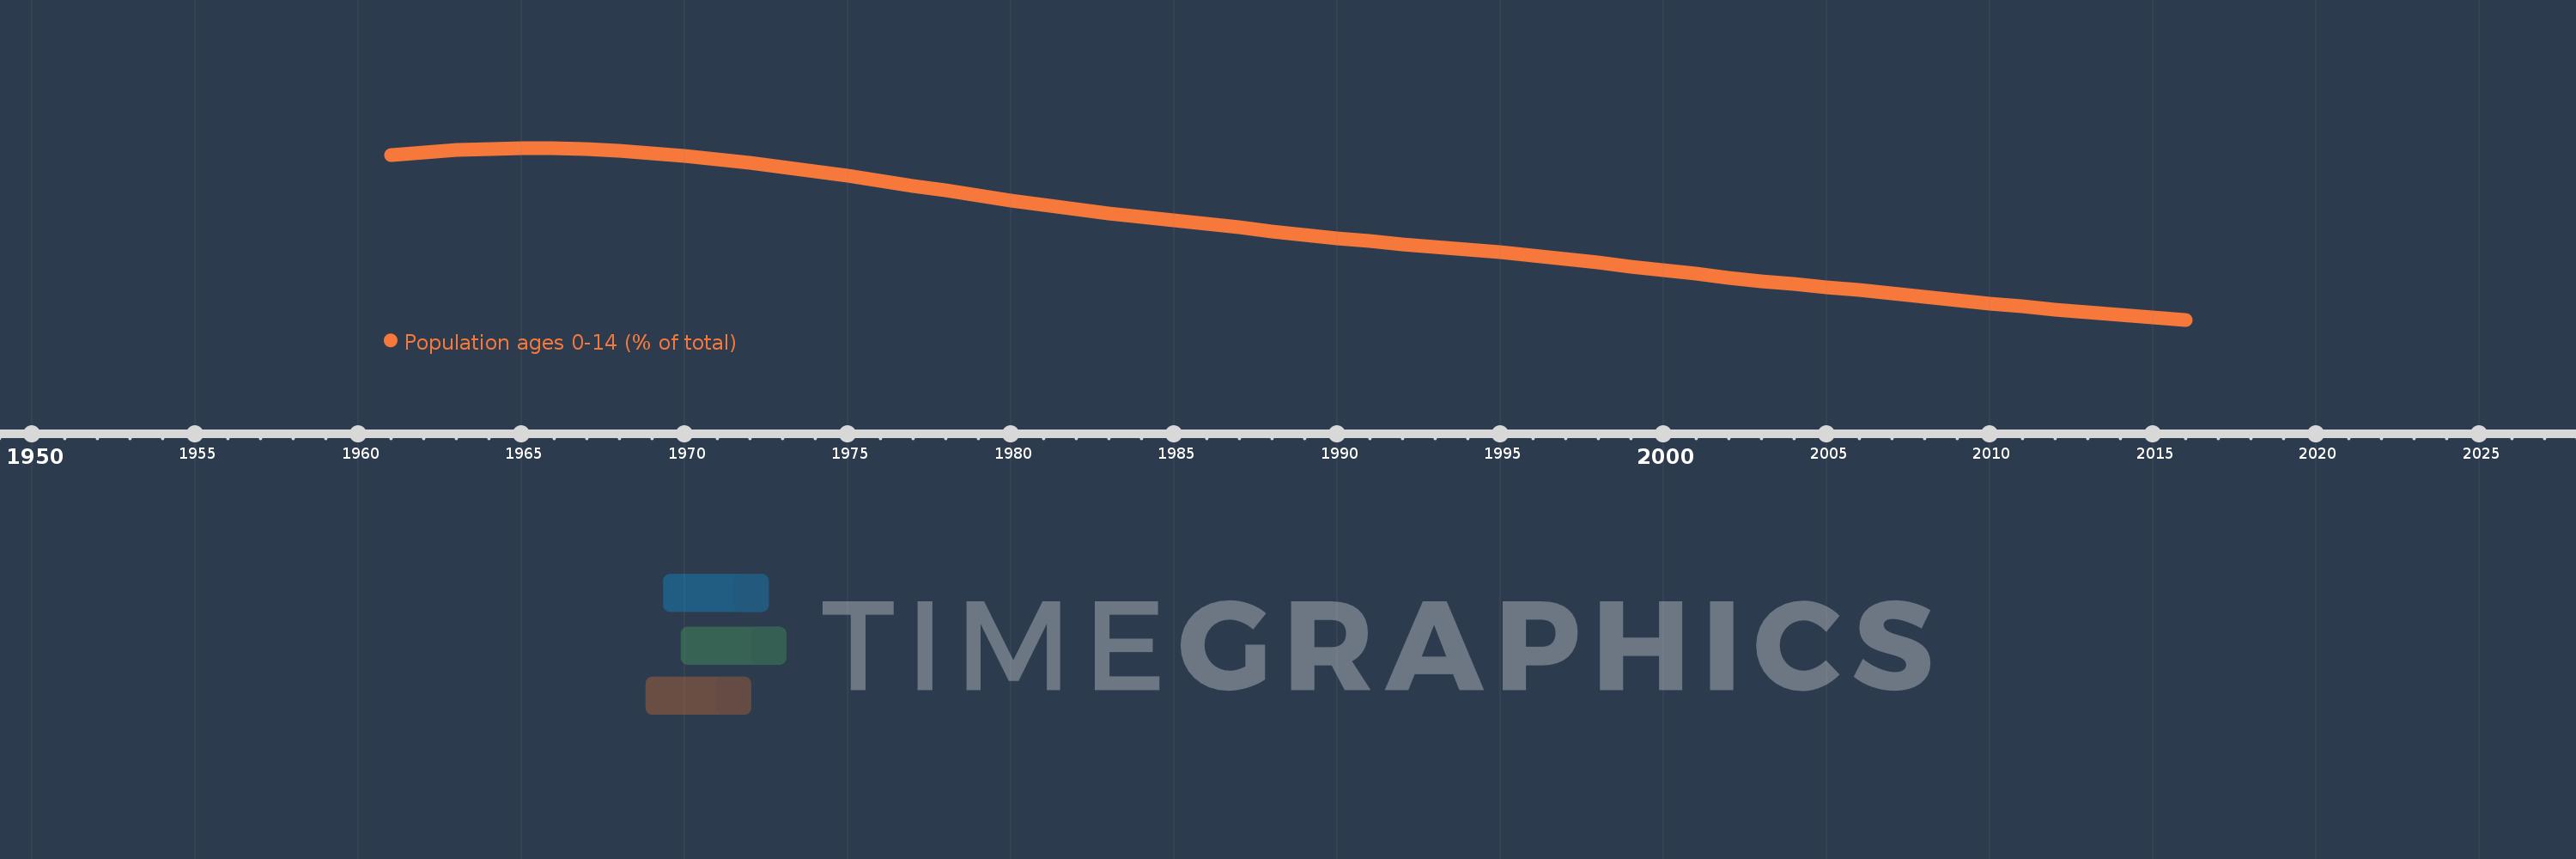
Population ages 0-14 (% of total)
2016,2015,2014,2013,2012,2011,2010,2009,2008,2007,2006,2005,2004,2003,2002,2001,2000,1999,1998,1997,1996,1995,1994,1993,1992,1991,1990,1989,1988,1987,1986,1985,1984,1983,1982,1981,1980,1979,1978,1977,1976,1975,1974,1973,1972,1971,1970,1969,1968,1967,1966,1965,1964,1963,1962,1961
Queste statistiche in altri paesi:
AfghanistanAlbaniaAlgeriaAngolaAntigua and BarbudaArab WorldArgentinaArmeniaArubaAustraliaAustriaAzerbaijanBahamas, TheBahrainBangladeshBarbadosBelarusBelgiumBelizeBeninBhutanBoliviaBosnia and HerzegovinaBotswanaBrazilBrunei DarussalamBulgariaBurkina FasoBurundiCabo VerdeCambodiaCameroonCanadaCaribbean small statesCentral African RepublicCentral Europe and the BalticsChadChannel IslandsChileChinaColombiaComorosCongo, Dem. Rep.Congo, Rep.Costa RicaCote d'IvoireCroatiaCubaCuracaoCyprusCzech RepublicDenmarkDjiboutiDominican RepublicEarly-demographic dividendEast Asia & PacificEast Asia & Pacific (excluding high income)East Asia & Pacific (IDA & IBRD countries)EcuadorEgypt, Arab Rep.El SalvadorEquatorial GuineaEritreaEstoniaEthiopiaEuro areaEurope & Central AsiaEurope & Central Asia (excluding high income)Europe & Central Asia (IDA & IBRD countries)European UnionFijiFinlandFragile and conflict affected situationsFranceFrench PolynesiaGabonGambia, TheGeorgiaGermanyGhanaGreeceGrenadaGuamGuatemalaGuineaGuinea-BissauGuyanaHaitiHeavily indebted poor countries (HIPC)High incomeHondurasHong Kong SAR, ChinaHungaryIBRD onlyIcelandIDA & IBRD totalIDA blendIDA onlyIDA totalIndiaIndonesiaIran, Islamic Rep.IraqIrelandIsraelItalyJamaicaJapanJordanKazakhstanKenyaKiribatiKorea, Dem. People’s Rep.Korea, Rep.KosovoKuwaitKyrgyz RepublicLao PDRLate-demographic dividendLatin America & Caribbean Latin America & Caribbean (excluding high income)Latin America & the Caribbean (IDA & IBRD countries)LatviaLeast developed countries: UN classificationLebanonLesothoLiberiaLibyaLithuaniaLow & middle incomeLow incomeLower middle incomeLuxembourgMacao SAR, ChinaMacedonia, FYRMadagascarMalawiMalaysiaMaldivesMaliMaltaMauritaniaMauritiusMexicoMicronesia, Fed. Sts.Middle East & North AfricaMiddle East & North Africa (excluding high income)Middle East & North Africa (IDA & IBRD countries)Middle incomeMoldovaMongoliaMontenegroMoroccoMozambiqueMyanmarNamibiaNepalNetherlandsNew CaledoniaNew ZealandNicaraguaNigerNigeriaNorth AmericaNorwayOECD membersOmanOther small statesPacific island small statesPakistanPanamaPapua New GuineaParaguayPeruPhilippinesPolandPortugalPost-demographic dividendPre-demographic dividendPuerto RicoQatarRomaniaRussian FederationRwandaSamoaSao Tome and PrincipeSaudi ArabiaSenegalSerbiaSeychellesSierra LeoneSingaporeSlovak RepublicSloveniaSmall statesSolomon IslandsSomaliaSouth AfricaSouth AsiaSouth Asia (IDA & IBRD)South SudanSpainSri LankaSt. LuciaSt. Vincent and the GrenadinesSub-Saharan Africa Sub-Saharan Africa (excluding high income)Sub-Saharan Africa (IDA & IBRD countries)SudanSurinameSwazilandSwedenSwitzerlandSyrian Arab RepublicTajikistanTanzaniaThailandTimor-LesteTogoTongaTrinidad and TobagoTunisiaTurkeyTurkmenistanUgandaUkraineUnited Arab EmiratesUnited KingdomUnited StatesUpper middle incomeUruguayUzbekistanVanuatuVenezuela, RBVietnamVirgin Islands (U.S.)West Bank and GazaWorldYemen, Rep.ZambiaZimbabwe Linea del tempo:
Questa scala temporale mostra un grafico dal 1961 anno al 2016 anno. Dominican Republic. I dati fino ad 1960 anno non disponibili. Il numero di osservazioni attuali secondo i date: 56.
La fonte (nome):
Indicatori dello sviluppo mondiale
La fonte (organizzazione):
World Bank staff estimates based on age distributions of United Nations Population Division's World Population Prospects.
Categorie:
Education, Health
sono stati aggiornati
23 apr 2017 anni
Indicatori delle variazioni dei valori per anni
Minima:
29.959
1 gen 2016 anni
Massimo:
49.014
1 gen 1965 anni
Alla data di osservazione
Valore
Variazione assoluta
La variazione rispetto al valore precedente
1 gen 1961 anni
48.201
+48.201
0.0%
1 gen 1962 anni
48.505
+0.304
0.63%
1 gen 1963 anni
48.752
+0.247
0.51%
1 gen 1964 anni
48.929
+0.178
0.36%
1 gen 1965 anni
49.014
+0.085
0.17%
1 gen 1966 anni
48.992
-0.022
-0.04%
1 gen 1967 anni
48.904
-0.088
-0.18%
1 gen 1968 anni
48.718
-0.186
-0.38%
1 gen 1969 anni
48.451
-0.266
-0.55%
1 gen 1970 anni
48.124
-0.327
-0.68%
1 gen 1971 anni
47.746
-0.378
-0.79%
1 gen 1972 anni
47.338
-0.408
-0.86%
1 gen 1973 anni
46.888
-0.45
-0.95%
1 gen 1974 anni
46.405
-0.482
-1.03%
1 gen 1975 anni
45.897
-0.508
-1.09%
1 gen 1976 anni
45.367
-0.53
-1.16%
1 gen 1977 anni
44.839
-0.528
-1.16%
1 gen 1978 anni
44.293
-0.546
-1.22%
1 gen 1979 anni
43.744
-0.549
-1.24%
1 gen 1980 anni
43.213
-0.531
-1.21%
1 gen 1981 anni
42.709
-0.504
-1.17%
1 gen 1982 anni
42.213
-0.496
-1.16%
1 gen 1983 anni
41.767
-0.447
-1.06%
1 gen 1984 anni
41.356
-0.411
-0.98%
1 gen 1985 anni
40.959
-0.397
-0.96%
1 gen 1986 anni
40.561
-0.397
-0.97%
1 gen 1987 anni
40.18
-0.381
-0.94%
1 gen 1988 anni
39.785
-0.395
-0.98%
1 gen 1989 anni
39.393
-0.393
-0.99%
1 gen 1990 anni
39.027
-0.365
-0.93%
1 gen 1991 anni
38.697
-0.33
-0.85%
1 gen 1992 anni
38.33
-0.366
-0.95%
1 gen 1993 anni
38.015
-0.315
-0.82%
1 gen 1994 anni
37.725
-0.291
-0.76%
1 gen 1995 anni
37.417
-0.308
-0.82%
1 gen 1996 anni
37.069
-0.348
-0.93%
1 gen 1997 anni
36.71
-0.359
-0.97%
1 gen 1998 anni
36.298
-0.412
-1.12%
1 gen 1999 anni
35.858
-0.44
-1.21%
1 gen 2000 anni
35.434
-0.424
-1.18%
1 gen 2001 anni
35.048
-0.386
-1.09%
1 gen 2002 anni
34.615
-0.433
-1.24%
1 gen 2003 anni
34.253
-0.362
-1.05%
1 gen 2004 anni
33.929
-0.324
-0.95%
1 gen 2005 anni
33.596
-0.333
-0.98%
1 gen 2006 anni
33.234
-0.362
-1.08%
1 gen 2007 anni
32.896
-0.338
-1.02%
1 gen 2008 anni
32.517
-0.379
-1.15%
1 gen 2009 anni
32.124
-0.393
-1.21%
1 gen 2010 anni
31.757
-0.367
-1.14%
1 gen 2011 anni
31.433
-0.324
-1.02%
1 gen 2012 anni
31.091
-0.341
-1.09%
1 gen 2013 anni
30.797
-0.295
-0.95%
1 gen 2014 anni
30.529
-0.268
-0.87%
1 gen 2015 anni
30.255
-0.274
-0.9%
1 gen 2016 anni
29.959
-0.296
-0.98%
Classificazione dei paesi secondo i statistiche attuali per anni


Commenti: