29
/it/
it
AIzaSyAYiBZKx7MnpbEhh9jyipgxe19OcubqV5w
April 1, 2024
170376
Korea, Rep.
KOR
true
2
1
Population ages 0-14 (% of total)
2016,2015,2014,2013,2012,2011,2010,2009,2008,2007,2006,2005,2004,2003,2002,2001,2000,1999,1998,1997,1996,1995,1994,1993,1992,1991,1990,1989,1988,1987,1986,1985,1984,1983,1982,1981,1980,1979,1978,1977,1976,1975,1974,1973,1972,1971,1970,1969,1968,1967,1966,1965,1964,1963,1962,1961
Queste statistiche in altri paesi:
AfghanistanAlbaniaAlgeriaAngolaAntigua and BarbudaArab WorldArgentinaArmeniaArubaAustraliaAustriaAzerbaijanBahamas, TheBahrainBangladeshBarbadosBelarusBelgiumBelizeBeninBhutanBoliviaBosnia and HerzegovinaBotswanaBrazilBrunei DarussalamBulgariaBurkina FasoBurundiCabo VerdeCambodiaCameroonCanadaCaribbean small statesCentral African RepublicCentral Europe and the BalticsChadChannel IslandsChileChinaColombiaComorosCongo, Dem. Rep.Congo, Rep.Costa RicaCote d'IvoireCroatiaCubaCuracaoCyprusCzech RepublicDenmarkDjiboutiDominican RepublicEarly-demographic dividendEast Asia & PacificEast Asia & Pacific (excluding high income)East Asia & Pacific (IDA & IBRD countries)EcuadorEgypt, Arab Rep.El SalvadorEquatorial GuineaEritreaEstoniaEthiopiaEuro areaEurope & Central AsiaEurope & Central Asia (excluding high income)Europe & Central Asia (IDA & IBRD countries)European UnionFijiFinlandFragile and conflict affected situationsFranceFrench PolynesiaGabonGambia, TheGeorgiaGermanyGhanaGreeceGrenadaGuamGuatemalaGuineaGuinea-BissauGuyanaHaitiHeavily indebted poor countries (HIPC)High incomeHondurasHong Kong SAR, ChinaHungaryIBRD onlyIcelandIDA & IBRD totalIDA blendIDA onlyIDA totalIndiaIndonesiaIran, Islamic Rep.IraqIrelandIsraelItalyJamaicaJapanJordanKazakhstanKenyaKiribatiKorea, Dem. People’s Rep.Korea, Rep.KosovoKuwaitKyrgyz RepublicLao PDRLate-demographic dividendLatin America & Caribbean Latin America & Caribbean (excluding high income)Latin America & the Caribbean (IDA & IBRD countries)LatviaLeast developed countries: UN classificationLebanonLesothoLiberiaLibyaLithuaniaLow & middle incomeLow incomeLower middle incomeLuxembourgMacao SAR, ChinaMacedonia, FYRMadagascarMalawiMalaysiaMaldivesMaliMaltaMauritaniaMauritiusMexicoMicronesia, Fed. Sts.Middle East & North AfricaMiddle East & North Africa (excluding high income)Middle East & North Africa (IDA & IBRD countries)Middle incomeMoldovaMongoliaMontenegroMoroccoMozambiqueMyanmarNamibiaNepalNetherlandsNew CaledoniaNew ZealandNicaraguaNigerNigeriaNorth AmericaNorwayOECD membersOmanOther small statesPacific island small statesPakistanPanamaPapua New GuineaParaguayPeruPhilippinesPolandPortugalPost-demographic dividendPre-demographic dividendPuerto RicoQatarRomaniaRussian FederationRwandaSamoaSao Tome and PrincipeSaudi ArabiaSenegalSerbiaSeychellesSierra LeoneSingaporeSlovak RepublicSloveniaSmall statesSolomon IslandsSomaliaSouth AfricaSouth AsiaSouth Asia (IDA & IBRD)South SudanSpainSri LankaSt. LuciaSt. Vincent and the GrenadinesSub-Saharan Africa Sub-Saharan Africa (excluding high income)Sub-Saharan Africa (IDA & IBRD countries)SudanSurinameSwazilandSwedenSwitzerlandSyrian Arab RepublicTajikistanTanzaniaThailandTimor-LesteTogoTongaTrinidad and TobagoTunisiaTurkeyTurkmenistanUgandaUkraineUnited Arab EmiratesUnited KingdomUnited StatesUpper middle incomeUruguayUzbekistanVanuatuVenezuela, RBVietnamVirgin Islands (U.S.)West Bank and GazaWorldYemen, Rep.ZambiaZimbabwe Linea del tempo:
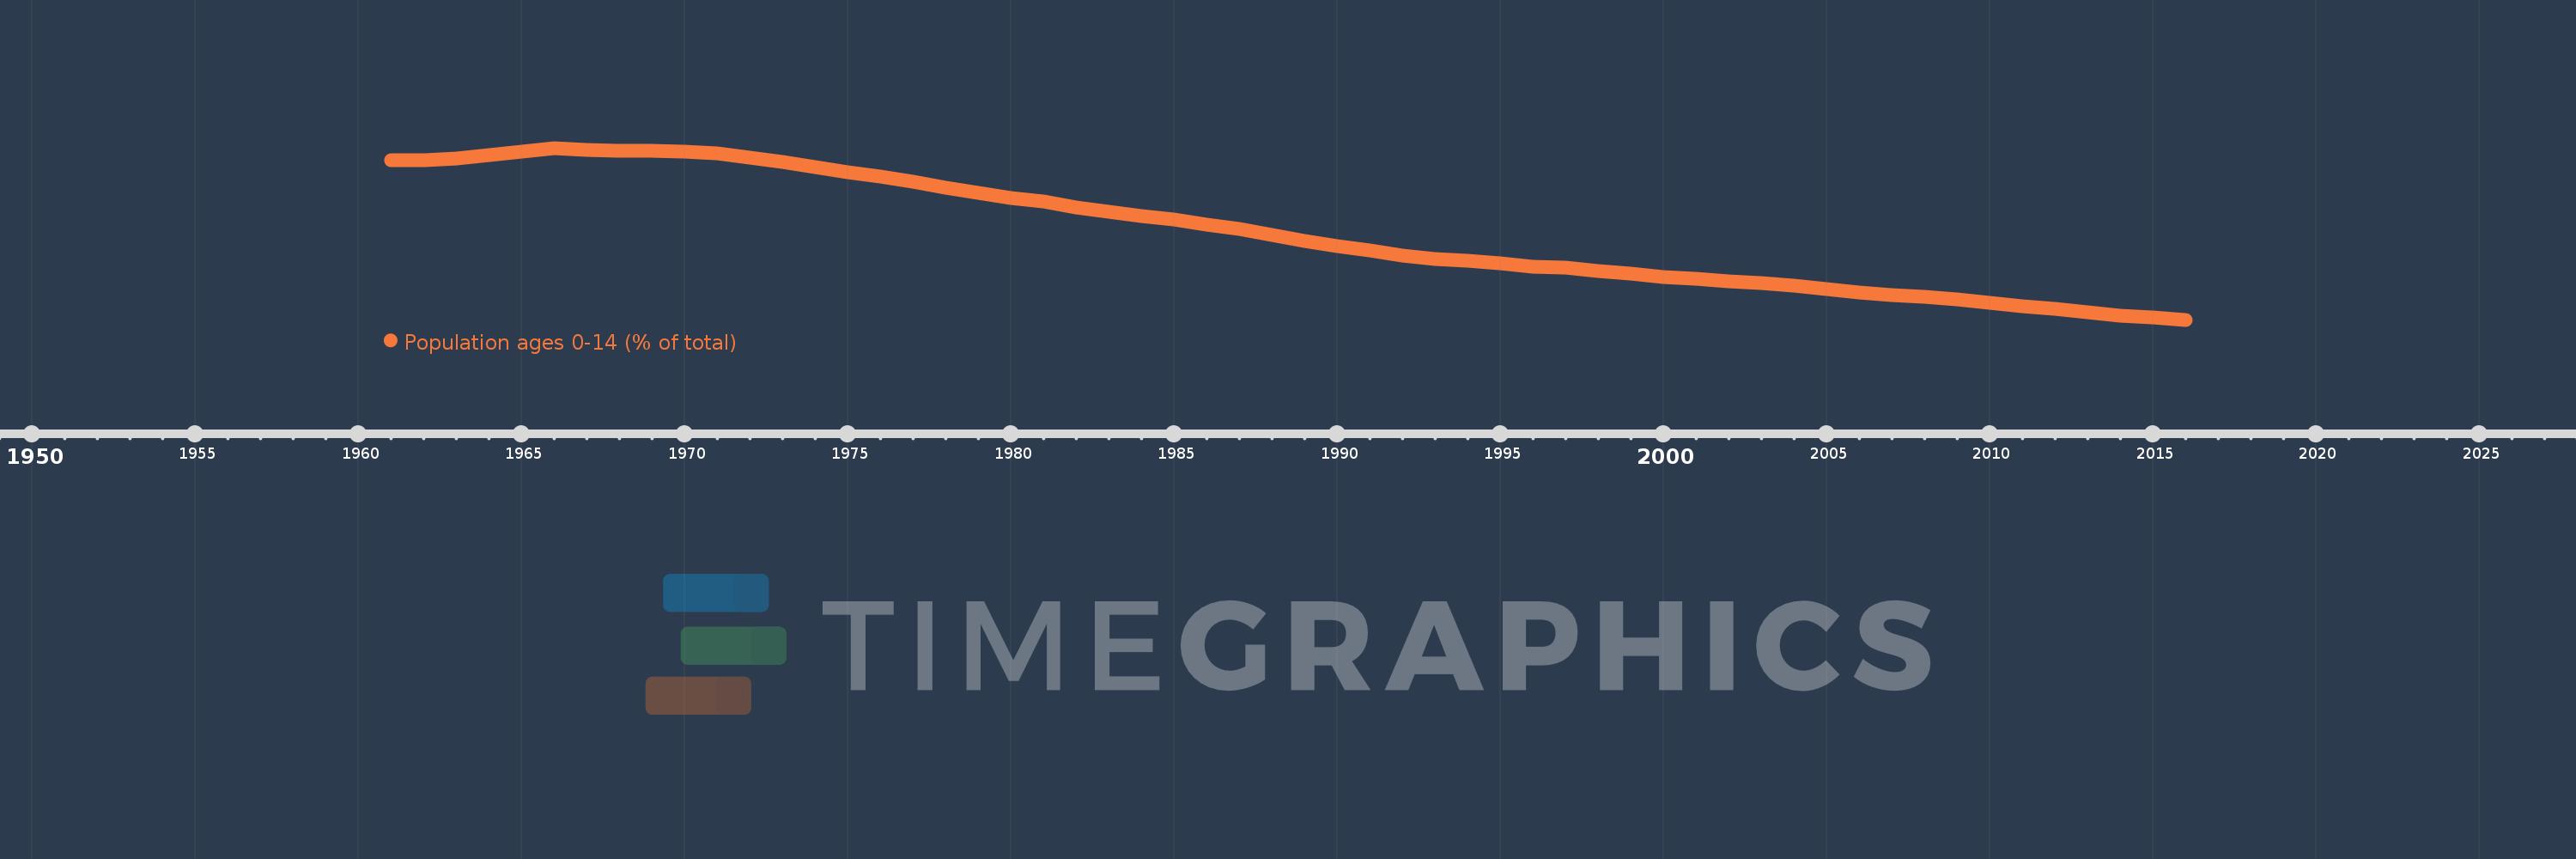
Questa scala temporale mostra un grafico dal 1961 anno al 2016 anno. Korea, Rep.. I dati fino ad 1960 anno non disponibili. Il numero di osservazioni attuali secondo i date: 56.
La fonte (nome):
Indicatori dello sviluppo mondiale
La fonte (organizzazione):
World Bank staff estimates based on age distributions of United Nations Population Division's World Population Prospects.
Categorie:
Education, Health
sono stati aggiornati
23 apr 2017 anni
Indicatori delle variazioni dei valori per anni
Minima:
13.993
1 gen 2016 anni
Massimo:
43.014
1 gen 1966 anni
Alla data di osservazione
Valore
Variazione assoluta
La variazione rispetto al valore precedente
1 gen 1961 anni
40.908
+40.908
0.0%
1 gen 1962 anni
40.932
+0.024
0.06%
1 gen 1963 anni
41.263
+0.331
0.81%
1 gen 1964 anni
41.807
+0.544
1.32%
1 gen 1965 anni
42.427
+0.619
1.48%
1 gen 1966 anni
43.014
+0.588
1.39%
1 gen 1967 anni
42.693
-0.321
-0.75%
1 gen 1968 anni
42.589
-0.104
-0.24%
1 gen 1969 anni
42.542
-0.048
-0.11%
1 gen 1970 anni
42.409
-0.132
-0.31%
1 gen 1971 anni
42.131
-0.279
-0.66%
1 gen 1972 anni
41.445
-0.686
-1.63%
1 gen 1973 anni
40.646
-0.799
-1.93%
1 gen 1974 anni
39.8
-0.847
-2.08%
1 gen 1975 anni
38.967
-0.832
-2.09%
1 gen 1976 anni
38.158
-0.809
-2.08%
1 gen 1977 anni
37.24
-0.918
-2.41%
1 gen 1978 anni
36.292
-0.948
-2.55%
1 gen 1979 anni
35.39
-0.902
-2.49%
1 gen 1980 anni
34.598
-0.792
-2.24%
1 gen 1981 anni
33.92
-0.679
-1.96%
1 gen 1982 anni
32.971
-0.949
-2.8%
1 gen 1983 anni
32.209
-0.762
-2.31%
1 gen 1984 anni
31.553
-0.655
-2.03%
1 gen 1985 anni
30.865
-0.688
-2.18%
1 gen 1986 anni
30.067
-0.797
-2.58%
1 gen 1987 anni
29.315
-0.752
-2.5%
1 gen 1988 anni
28.349
-0.966
-3.29%
1 gen 1989 anni
27.299
-1.05
-3.71%
1 gen 1990 anni
26.363
-0.936
-3.43%
1 gen 1991 anni
25.631
-0.731
-2.77%
1 gen 1992 anni
24.793
-0.838
-3.27%
1 gen 1993 anni
24.263
-0.53
-2.14%
1 gen 1994 anni
23.904
-0.359
-1.48%
1 gen 1995 anni
23.501
-0.402
-1.68%
1 gen 1996 anni
22.97
-0.532
-2.26%
1 gen 1997 anni
22.753
-0.217
-0.94%
1 gen 1998 anni
22.287
-0.465
-2.05%
1 gen 1999 anni
21.717
-0.57
-2.56%
1 gen 2000 anni
21.248
-0.469
-2.16%
1 gen 2001 anni
20.96
-0.289
-1.36%
1 gen 2002 anni
20.488
-0.471
-2.25%
1 gen 2003 anni
20.117
-0.372
-1.81%
1 gen 2004 anni
19.727
-0.39
-1.94%
1 gen 2005 anni
19.204
-0.523
-2.65%
1 gen 2006 anni
18.543
-0.661
-3.44%
1 gen 2007 anni
18.221
-0.322
-1.74%
1 gen 2008 anni
17.895
-0.326
-1.79%
1 gen 2009 anni
17.456
-0.439
-2.45%
1 gen 2010 anni
16.886
-0.57
-3.27%
1 gen 2011 anni
16.24
-0.646
-3.82%
1 gen 2012 anni
15.775
-0.465
-2.86%
1 gen 2013 anni
15.247
-0.528
-3.34%
1 gen 2014 anni
14.737
-0.511
-3.35%
1 gen 2015 anni
14.313
-0.424
-2.88%
1 gen 2016 anni
13.993
-0.32
-2.24%
Classificazione dei paesi secondo i statistiche attuali per anni


Commenti: